Tag: demographics
Millennials Are Really Worried About The Economy — And Their Future

Millennials Are Really Worried About The Economy — And Their Future

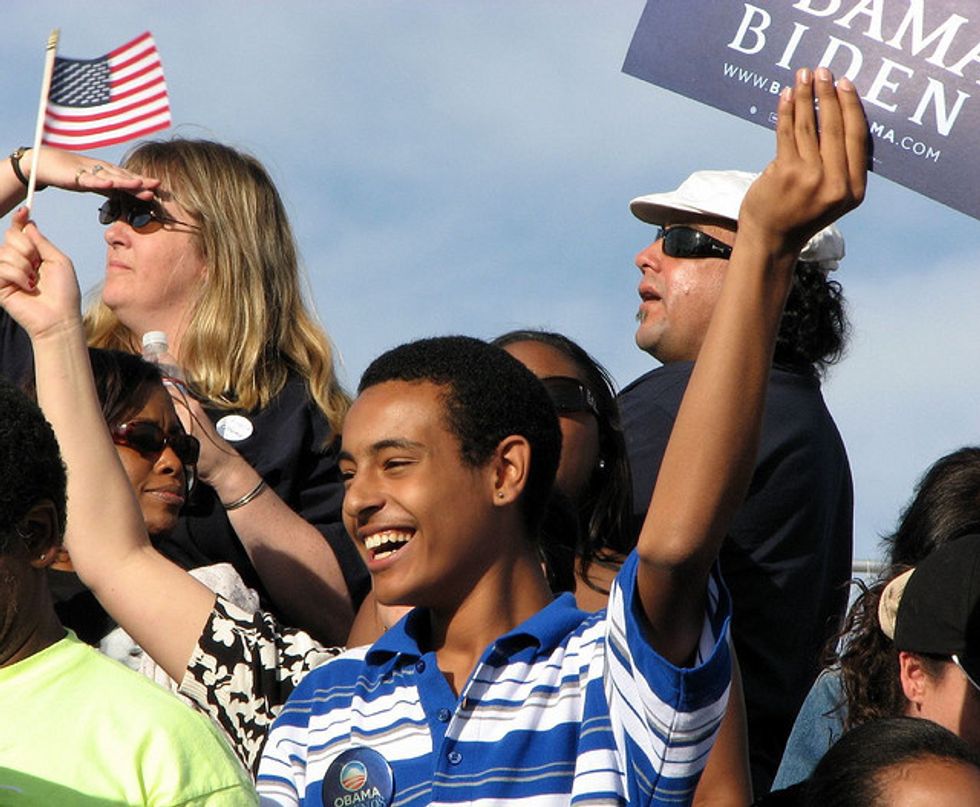
Millennials now constitute the largest voting bloc in the country, but they are considered the most politically disengaged. Despite counting 88 million people, only 45 percent of them voted in the 2012 elections; in 2008, an election with historic turnout, only 49 percent of 18-to-24-year-olds voted. That leaves a huge swatch of Millennials unengaged and possibly uninterested in national elections, and demographers, marketers, activists and politicians are wondering why.

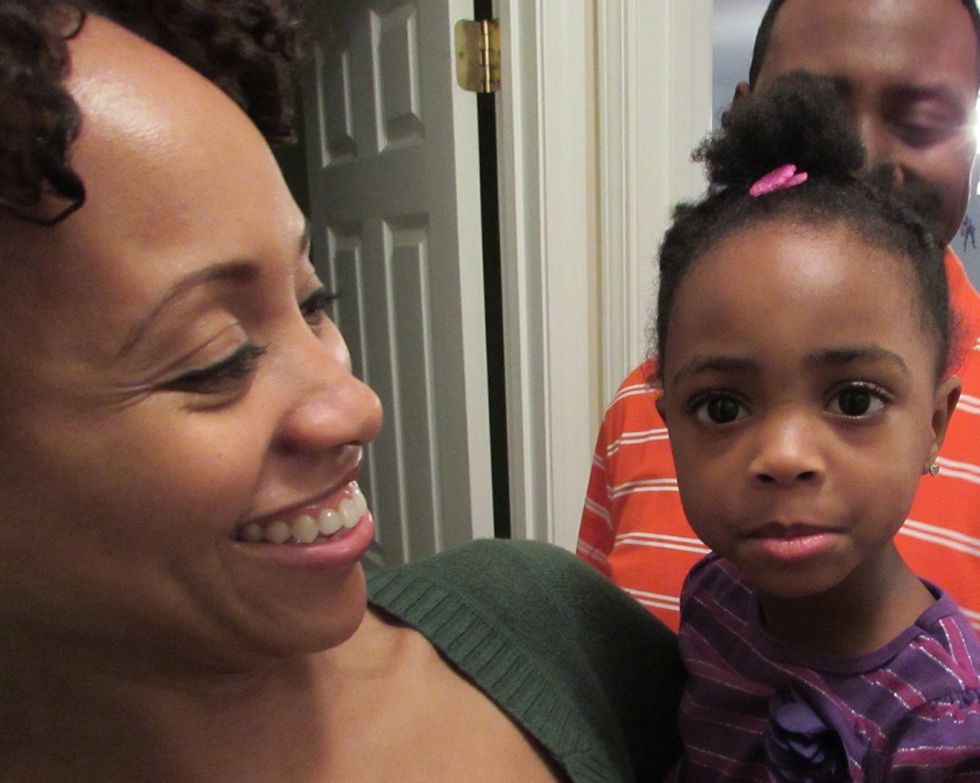
A new report by Democracy Corps offers some clues, highlighting two demographic segments within the millennial generation – white men and black women – who on the surface would seem to have different concerns. Yet members of both, questioned in focus groups that were conducted last month in Philadelphia, revealed that economic concerns are central to their daily struggles — and their political leanings.

Although specific candidates were not discussed, the report underpins why Bernie Sanders has been so successful in capturing the Millennial vote among Democrats. Sanders’ message of a broken political system, and his advocacy of an America that works to reduce its burden on young people, resonates with Millennials struggling to make enough money to start their adult lives.

Reducing the gaps between the rich and poor by providing opportunities for all was the primary concern for both groups, despite the general socioeconomic differences between white men, historically winners in the American economic order, and black women, who have often been left behind. “Let’s just level the playing field so the middle class can grow. Like we were talking about earlier, the economy, how it was different from back in the day until now,” said a black female attendee.

Both focus groups felt excluded from the recent economic growth the country has enjoyed, owing to corporations that enjoy excessive political influence and favorable tax codes. They described the winners of the economic system as “the top percent,” “Trump,” and “scumbags,” reflecting a majority attitude that inequality has gotten worse between the rich and poor, borne out by statistical data: Between 2009 and 2012, the top one percent of Americans saw their income increase by 34.7 percent while everyone else had their wages increase by 0.8 percent.

With millennials making up 40 percent of the country’s unemployed, disillusionment with the economic system is not unusual among the most educated generation in the country’s history, who often struggle to find well-paying, stable employment. This week’s news that the jobless rate has dropped below five percent for the first time since 2008 means little for a demographic slice that suffers from a 13.8 percent unemployment rate.

Job opportunities are particularly important for millennials, who are collectively saddled with over $1 trillion of student debt. Almost all attendees described student loans as a major impediment to purchasing even basic consumer items. “You want to put gas in your car or you want to pay your student loan? I mean, that’s just what it is,” said one of the white male attendees. Another said, “I’m in some crazy debt and I’m only 24.” While a college diploma or graduate degree is still viewed as a ticket to a higher standard of living, that promise has failed to materialize for millennials as a whole.

Even though millennials are working longer hours, they are getting paid less and expected to do the work of two people. “Just from experience, the expectations are a little unrealistic. They expect so much but offer little,” said one of the black women. That reality has been particularly discouraging to the focus group members, many of whom still live at home and feel they aren’t paying off their student loans fast enough. A white man said, “I still live at home with my mom and dad, I haven’t moved out. You know, I’m working hard, but there’s no payoff to it, you know?”

And while not describing themselves as politically active (several made statements to the effect that “this is probably the first time I ever talked about politics”), many in the focus groups said they were repelled by the rhetoric coming out of the Republican presidential candidates. One white millennial from the group described the GOP lineup as “cartoon characters, Looney Tunes.”

“Disgusted,” “ashamed,” “repulsed,” and “disappointed” were used by the black women’s focus group in describing the candidates. The economic views espoused by the Republican candidates, promoting more tax cuts for billionaires and trickle-down economics, only reinforced that view.

Although this was a small focus group, their concerns were not any different from larger surveys of millennials, or indeed many Americans no matter their age, and speaks to a larger truth: candidates who want their votes will have to speak to their deepest worries.

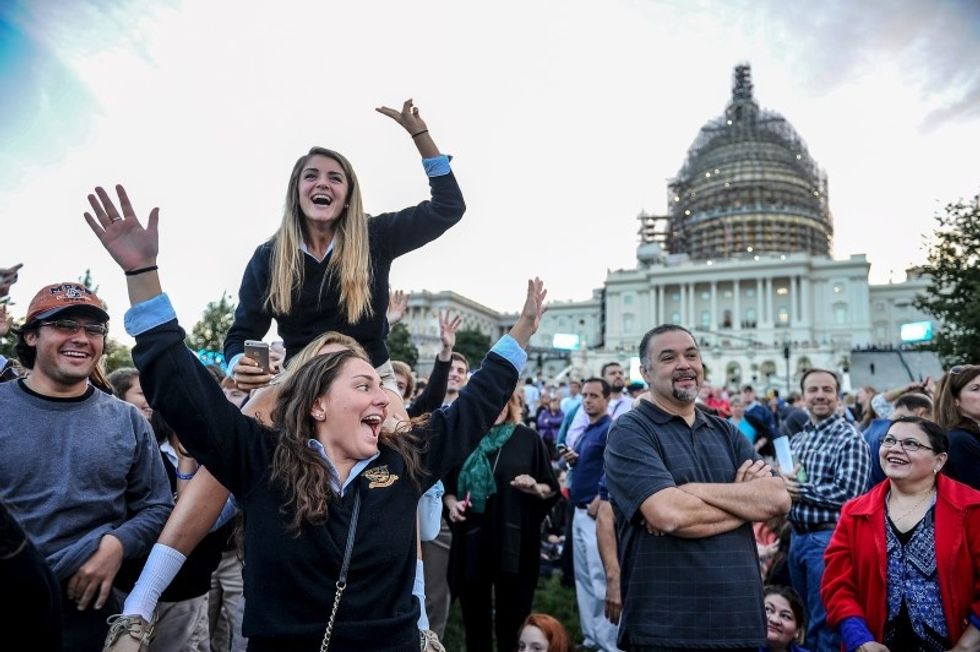
Photo: A bunch of young people in front of the U.S. Capitol. REUTERS/Mary F. Calvert

U.S. Birth Rate Finally Rises, Thanks To Moms In Their 30s And Early 40s

U.S. Birth Rate Finally Rises, Thanks To Moms In Their 30s And Early 40s

By Karen Kaplan, Los Angeles Times (TNS)

The nation’s birth rate rose 1 percent last year as parents in the U.S. welcomed nearly 4 million babies into the world, according to a new report from the Centers for Disease Control and Prevention.

That increase may not sound like much, but it’s the first time the birth rate has gone up in seven years.

The bump in births was courtesy of women in their 30s and 40s, the CDC data show. The birth rate jumped 3 percent for women between the ages of 30 and 39 and 2 percent for women ages 40 to 44.

Women between the ages of 25 and 29 and ages 45 and older had babies at the same rate in 2014 as they did in 2013.

The birth rate fell 2 percent for younger women in their 20s, and it plunged 9 percent for teenagers. In fact, the teen pregnancy rate hit another all-time low of 24.2 births per 1,000 young women between the ages of 15 and 19. That represents a 61 percent decline since 1991, the most recent peak for teen births, according to the report.

Overall, the birth rate — also known as the general fertility rate — was 62.9 births per 1,000 women, according to data compiled by the CDC’s National Center for Health Statistics. That added up to 3,985,924 live births in 2014.

But that wasn’t enough babies to keep the U.S. population steady, the report authors noted. Their calculations showed that a hypothetical group of 1,000 women would give birth to 1,861.5 babies over their entire lives. But in order for a generation to replace itself, those 1,000 women would need to have 2,100 babies. That hasn’t been the case since 2007, the researchers wrote.

Women in nearly all racial and ethnic groups gave birth to more babies in 2014, the CDC noted. The birth rates for whites, African-Americans and Latinas all rose by 1 percent in 2014, and it rose 6 percent for Asian-Americans. The only exceptions were Native American and Alaska Native women, whose birth rate declined 2 percent.

The birth rate for new mothers was slightly lower in 2014 than in 2013, declining by less than 1 percent. However, the rate of second births rose 1 perccent, third births increased 2 percent and the birth rate for additional children grew by 3 percent.

The total number of babies born to unmarried women rose by nearly 9,000 in 2014, up 1 percent compared with the previous year. However, the birth rate for these women actually declined by 1 percent.

The rate of preterm births — those that occurred before 37 weeks of pregnancy — also fell slightly from 9.62 percent in 2013 to 9.57 percent in 2014. In addition, 8 percent of babies born in 2014 weighed less than 5 pounds, 8 ounces and were considered to have a low birth weight, the same as in 2013.

The data in the study came from birth records in all 50 states and the District of Columbia. Ten states contributed incomplete data, and the study authors estimate that their nationwide figures account for 99.7 percent of the births that actually occurred last year.

Photo: Cuties. Aimee Ray via Flickr

Race And Religion Split Electorate As Campaigns Begin

Race And Religion Split Electorate As Campaigns Begin

By David Lauter, Tribune Washington Bureau (TNS)

WASHINGTON — As presidential hopefuls officially begin their campaigns, the two parties face each other with opposing coalitions clearly defined along lines of race, religion, and culture.

Nearly 90 percent of the Americans who identify or lean to the Republican Party are white. In particular, white, evangelical Protestants, who make up just under one-fifth of the overall U.S. population, account for more than one-third of those who back the GOP.

By contrast, the Democrats depend heavily on minorities, people without a religious affiliation, and the most highly educated segment of the white population, particularly women with graduate or professional degrees.

The contrasting portraits come from extensive data about party preferences released Tuesday by the nonpartisan Pew Research Center. The data, drawn from about 25,000 interviews Pew conducted last year for its surveys, provides a detailed look at where the two parties stand as the presidential campaign begins to take shape.

The share of Americans who openly identify with either of the two major parties has declined over the last decade as more Americans call themselves independents. Most of those self-described independents, however, lean toward one party or the other, and they have voting behavior that is almost as predictable as more open partisans.

The contrasting nature of the two coalitions drives the issues on which each party focuses. The Republicans’ heavy dependence on evangelical Protestants, for example, helps explain why the party’s lawmakers have backed what supporters call “religious freedom” legislation in many states and also why they have had so much difficulty navigating the fast-changing politics of that issue.

The Democrats’ reliance on minorities lies behind several of President Barack Obama’s policies, notably his push for an overhaul of the nation’s immigration laws in ways that would benefit many Latino and Asian-American families.

Because its candidates have done poorly with minorities in a nation that has grown steadily less white, the GOP needs to keep winning a bigger majority of white voters to prevail in presidential elections. Republican strategists have split in the past couple of years on whether the strategy of depending on white turnout remains viable in presidential contests.

Overall, the Democrats enjoy a 48 percent to 39 percent advantage in the share of Americans who lean their way, but that edge shrinks to 48-43 percent among registered voters, the Pew figures show.

The Democratic advantage has been fairly consistent going back to 1992, a period during which the party has won the popular vote in five out of six presidential elections. But in elections that don’t involve the White House, the voters whom Democrats count on do not turn out as reliably as Republican backers, creating a major advantage for the GOP in off-year contests.

While many of the demographic divisions between the two parties have been constant for years — Democrats consistently do better with women than with men; Republicans do better with married people than unmarried — the Pew data show two major recent shifts, one favoring each party.

Democrats have greatly improved their standing among Americans with graduate or professional degrees, particularly women.

In 1992, Americans with more than a college education divided their political loyalties equally between the two parties. But since the middle of the last decade, that group has become increasingly Democratic. They now favor the Democrats 56-36 percent.

Combine the gender gap with educational differences and the contrast become huge. Women with education beyond college favor Democrats by about two to one, for example. By contrast, white men without a college degree favor Republicans 54-33 percent.

The other major change has been the growing Republican advantage among white evangelicals, which has expanded steadily during Obama’s presidency. They now back Republicans 68-22 percent.

Although the two parties also have a generational divide — with older Americans favoring the GOP and younger ones leaning heavily toward Democrats — that difference has more to do with religion, ethnicity, and race than age itself.

The so-called Silent Generation, made of Americans born between 1929 and 1946, is the whitest of the country’s major age groups and favors the GOP 47-43 percent.

By contrast, Millennials, who range in age from 18 to 33, comprise the most racially and ethnically diverse generation in the voting population. They favor Democrats 51-35 percent, but mostly because more than four in ten of them are nonwhite. White members of the Millennial generation have political preferences much like their elders; nonwhites of their age favor Democrats 61-23 percent.

Photo: (Carrie Sloan) via Flickr

New Generation Of African Americans Are Moving Less

New Generation Of African Americans Are Moving Less

By Tim Henderson, Stateline.org (TNS)

STOCKBRIDGE, Georgia — Tavaras Powell moved hundreds of miles south to an Atlanta suburb in search of a job after getting his college degree 15 years ago. Here, he met and married Toye, who has lived in the area all her life.

The Powells — Tavaras, 37, and Toye, 35 — embody some of the latest trends in migration by African Americans: Some are moving for economic opportunity, but many are extremely loyal to childhood homes.

“I moved from home and she’s still home. It’s an interesting mix,” said Tavaras Powell.

A new study shows that today’s black families are less mobile than whites or previous generations of black families, and are tending to stay in the same state and even the same county where they were raised. Some scholars see this as evidence that blacks have been left out of recent regional booms in tech and energy, but it also may be that they simply are making shorter moves from cities to nearby suburbs.

The study, by sociologist Patrick Sharkey of New York University in the journal Demography, found a sharp difference between the current generation, born between 1952 and 1982, and earlier waves of African Americans who moved from the rural South to Northern cities in the last century, which historians call the Great Migration.

“This new geographic immobility is the most pronounced change in black Americans’ migration patterns after the Great Migration,” Sharkey wrote. “In the most recent generation, black Americans have remained in place to a degree that is unique relative to the previous generation and relative to whites of the same generation.”
___

MANY BLACKS IN SOUTH STAY PUT

Sharkey found that nationwide, 86 percent of African Americans born between 1952 and 1982 had not moved from the area where they grew up. For his study, he used a series of surveys that followed families from 1968 to 2007 that were conducted by the Panel Study of Income Dynamics at the University of Michigan.

A Stateline analysis shows that blacks are more likely than whites, Hispanics, or Asians in Southern states to have been born in the state where they live — ranging from 89 percent in Louisiana to 63 percent in Virginia and Georgia. The only exception is West Virginia, where white residents are more likely to have been born in the state than blacks.

The same also is true in California, Delaware, the District of Columbia, Illinois, Missouri, and Oklahoma.

Some scholars, such as Sandra Susan Smith, an associate professor of sociology at the University of California, Berkeley, worry that the findings imply that African Americans are not finding a place in job booms in construction, technology, and energy industries in other parts of the country.

Many cities and states have tried to create more jobs requiring highly skilled workers, including offering tax incentives to companies that provide them. But many African Americans don’t have the education and training for such jobs.

“The economic expansions of the last 25 years or so that might have inspired families to move have been concentrated in industries and occupations that have not been traditional niches for blacks,” said Smith, who is black. “If you’re black, these economic developments would not likely have caused you to pick up and leave.”

Smith also suggested that a lack of long-distance movement may mask a recent trend of black families moving out of inner cities and into the suburbs. That would help account for Sharkey’s findings that many blacks remain in the same states and even counties where they were born.

“This suggests that there is mobility, but much more contained than that studied by Sharkey,” Smith said. “Such a movement would likely reflect two phenomena: The increased economic cost of living in big cities, which pushes those without great means to the suburbs, where more than half of the poor now currently live, and the continued promise that the suburbs hold for many in the middle class — less crime, more space, and parks.”

Despite finding less migration, Sharkey did find a reversal of direction compared to previous generations, with today’s blacks tending to move to the South rather than to the North.

Sharkey said his findings don’t conflict with recent accounts of a new Great Migration by blacks headed to the South, as William Frey of The Brookings Institution called it in 2004 in looking at movement in the years 1965 to 2000.

Frey noted at the time that the South had gained black migrants in the 1990s, reversing a 35-year trend, with metro areas like Atlanta leading the way. There were “brain gains” in the South, Frey wrote, as Georgia, Texas and Maryland attracted the most black college graduates from 1995 to 2000.

“I don’t think it necessarily conflicts,” Sharkey said of his findings compared to Frey’s. “I do think the emphasis is different, as he hasn’t focused on the drop in long-range mobility.”

Frey acknowledged that he did not address generational differences as Sharkey did. “It may be the case that later generations of Northern blacks are not moving across counties or anywhere as much as earlier black generations,” Frey said.
____

STAYING AT HOME; ECONOMIC, CULTURAL FACTORS

When black Americans do move, it’s often for economic opportunity. That was the case for Tavaras Powell, who moved more than 300 miles south to seek his fortune in the Atlanta area after getting his college degree in 2000 from Elizabeth City State University in North Carolina.

“Atlanta was like the candy land. Everybody wanted to go,” said Powell, an environmentalist who monitors water quality in a neighboring county.

His wife Toye, meanwhile, said she has had no desire to move because she feels more comfortable near her hometown than in any other place she has visited. She is an elementary school teacher.

“You look at the news and you see African Americans in not the best light, but in Atlanta you see lots of positive examples,” she said. “It’s nice to see, in Atlanta, African Americans who are successful and doing a great job; you see doctors and lawyers. You get used to that and you just get kind of comfortable.”

Tavaras Powell has a family history that conforms with the Great Migration and return to the South. Several relatives in his grandparents’ generation moved from North Carolina to Bedford-Stuyvesant in Brooklyn, N.Y., where he often visited during the summer as a child. But in the 1990s they returned to their childhood home in North Carolina.

“They retired and went right back to the same spot, all in arm’s reach of each other. They had a totally different lifestyle and they came right back,” Tavaras Powell said.

Economics as well as a feeling of home also come into play. Carlotta Harrell, a management consultant in Henry County, who is black, happily remains here where her grandparents settled.

“I’ve done a lot of traveling, and to be perfectly honest there is no other place I would rather live,” said Harrell.

“The house that I live in would probably cost $2 million up North,” she said. “I hate the weather. And to me, the people up north are just not as friendly. There is such a thing as Southern hospitality.”
___

BLACKS AREN’T ALONE

African Americans aren’t the only ones who feel the lure of the South. Sharkey’s study showed that whites who had left the South were even more likely to return there — 14 percent of whites as opposed to nine percent of blacks, though blacks were more likely to return to the same county.

“It is my contention that all Southerners eventually go home,” said Allison Glock, a writer who is white and who has blogged about the difficulty of staying away from “the bleached-linen, biscuit-baking, horsefly-biting landscape of my childhood.”

For her, the lure was more cultural than economic, she said, although she doesn’t mind mentioning her low mortgage payments to New York City friends.

“I missed the easy sociability of the place,” she said. “When we get off the plane in Atlanta, I am always so happy to hear people chatting and joking with each other…Nobody talks to each other in Denver or Los Angeles. You strike up a conversation with a stranger in L.A. and it’s like you’ve asked them to take off their pants.”

Photo: Tim Henderson via Stateline