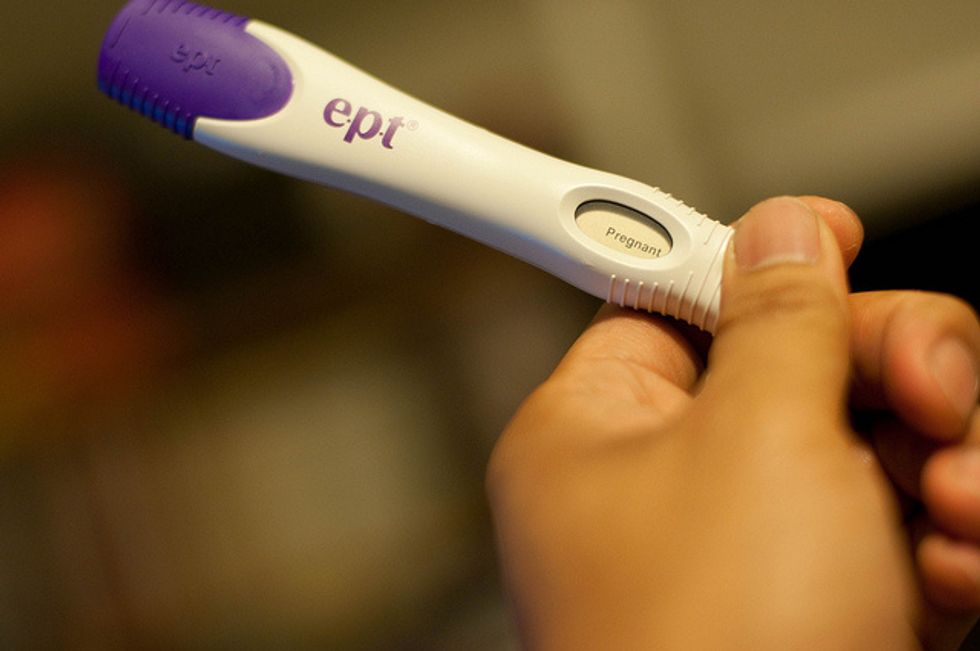
CDC Grades American Schools On How Well They Teach Sex Education

CDC Grades American Schools On How Well They Teach Sex Education

By Karen Kaplan, Los Angeles Times (TNS)

American high schools got generally good marks for their teaching of topics related to sex education, but there are still many areas in need of improvement, according to a new report card from the Centers for Disease Control and Prevention.

Across the country, 94 percent of high schools taught students the benefits of abstaining from sex, 88 percent explained why less is more when it comes to the number of sexual partners, and 92 percent discussed how family members, friends and the culture at large influence their sexual behaviors. In addition, 95 percent of schools explained to ninth- through 12th-graders how sexually transmitted diseases are spread and the health consequences of an STD infection, while 85 percent of schools taught students how to get products and services to help them prevent STDs and pregnancy.

High schools were less eager to give students specific information about condoms. For instance, 70 percent explained why it was important to use condoms correctly and consistently, 60 percent told students how to get condoms, and 54 percent demonstrated how to use them correctly.

“We need to do a better job of giving our young people the skills and knowledge they need to protect their own health,” Dr. Jonathan Mermin, who oversees the CDC’s HIV and STD prevention efforts, said in a statement.

Sex is often a taboo subject in schools, but public health officials say it’s essential to teach students how to reduce their risk of getting HIV and other STDs. There’s certainly evidence that many of them are in the dark — of the nearly 20 million new sexually transmitted infections reported each year, almost half are diagnosed in teens and young adults in their early 20s, CDC data show.

Accurate and specific sex education classes can also reduce teen pregnancy, which makes girls much more likely to drop out of school and sets their children on a path toward worse health and lower achievement.

“Lack of effective sex education can have very real, very serious health consequences,” Dr. Stephanie Zaza, director of CDC’s Division of Adolescent and School Health, said in a statement. “Young people who have multiple sex partners, don’t use condoms, and use drugs or alcohol before sex are at higher risk for HIV and other sexually transmitted infections. School-based sex education is a critical opportunity to provide the skills and information they need to protect themselves.”

Some states got higher grades for sex education than others. Three states — Delaware, New Hampshire and New Jersey — scored 100 percent for teaching the benefits of abstinence, and another 15 states scored at least 95 percent. But only 56 percent of Arizona schools explained the value of abstinence, as did a mere 60 percent of schools in Alaska.

Similarly, only two states — New Jersey and Vermont — had more than 90 percent of high schools teach students how to use condoms. In two other states – Arizona and South Dakota – less than one-third of schools did so.

Overall, only 46 percent of American high schools covered all 16 topics related to preventing pregnancy, HIV and other STDs that government health experts say are essential.

Middle schools got lower grades than high schools, according to the CDC report card. Nationwide, 77 percent of sixth-, seventh- and eighth-graders learned the benefits of abstinence and 75 percent were told how STDs are spread. Only 27 percent of middle school students got information about where to get condoms and 23 percent learned how to use them correctly.

The grades were published Wednesday in the CDC’s latest edition of its School Health Profiles report, which is based on survey data collected once every two years.

©2015 Los Angeles Times. Distributed by Tribune Content Agency, LLC.

Photo: Ernesto Andrade via Flickr


How Ecotourists Actually Make Things Worse For Wildlife

How Ecotourists Actually Make Things Worse For Wildlife

By Karen Kaplan, Los Angeles (TNS)

Sometimes it seems humans just can’t do anything right. The well-intentioned, conservation-minded people who spend millions of dollars a year on ecotourism might be making the very critters they’re trying to preserve more vulnerable to predators.

That’s the warning from a group of ecologists working in Brazil, France and the U.S. Writing in the journal Trends in Ecology & Evolution, they offer a plethora of reasons why wild animals might suffer from the benign attention of humans.

People visit protected nature areas an estimated 8 billion times a year, and they spend about $600 billion while doing so, according to a February report in PLOS Biology. What distinguishes these trips from other types of travel is that they allow tourists to see wild places in a way that “conserves the environment, sustains the well-being of the local people, and involves interpretation and education,” according to the International Ecotourism Society.

But there are several ways that these well-intentioned visits can backfire, the new report says.

For instance, simply spending time around humans can lull animals into a false sense of security. Evidence for this comes from studies of “flight initiation distance,” which is a measure of how close to a threat an animal is willing to be before it tries to escape. Researchers have found that the wild animals living around people in urban areas have smaller flight initiation distances than animals living in rural areas, where humans are more scarce.

In one experiment, urban fox squirrels allowed people to get seven times closer to them before running away compared with fox squirrels in rural areas. (Similar patterns have been observed with birds.) The foxes that were used to people also had a tamped-down response to the vocalizations of their predators, according to a 2009 study in the journal Landscape Ecology.

Even when people ignore the wildlife around them, they tend to create a “human shield” that protects certain animals that would otherwise wind up as prey, the authors of the new study warn. That’s because their predators are afraid to penetrate the human shield to hunt. As a result, the prey animals become less vigilant to threats.

When ecotourists venture into the wild, they create what amounts to a “temporary human shield,” the study authors wrote. Evidence for this comes from Grand Teton National Park, where the more tourist traffic there was, the less time pronghorn sheep and elk spent in “alert postures,” according to a 2014 report in PLOS One. The animals also gathered in smaller groups when more tourists were nearby.

There’s even biological evidence that some animals (in this case, iguanas) exposed to tourists produce fewer stress hormones.

In places where tourism is seasonal, the temporary protection afforded by tourists could make wildlife more vulnerable in the months when humans are not around, the new study warns.

Ecotourism may also make life easier for poachers, the study authors added. Some animals, such as elephants, are able to distinguish between threatening and nonthreatening humans. But other animals are less savvy. Field researchers have found that gorillas and Barbary macaques that have become habituated to tourists were slower to hide, flee or attack when poachers approached.

These risks may mean that ecotourism should be added to the list of human activities that are making the world less hospitable for wildlife – a list that includes things such as climate change, deforestation and pollution, the ecologists wrote.

Something to think about before you book your next vacation.

Photo: Jeff Gunn via Flickr  

American Cancer Society Abandons ‘One-Size-Fits-All’ Advice On Mammograms

American Cancer Society Abandons ‘One-Size-Fits-All’ Advice On Mammograms

By Karen Kaplan, Los Angeles Times (TNS)

After a thorough review of the benefits and limitations of mammograms, the nation’s top cancer-fighting organization is advising women that they can wait until they are 45 years old to start using the tests to screen for breast cancer.

New guidelines from the American Cancer Society also assure women that they can have fewer mammograms over the course of their lives.

The guidelines, published in Wednesday’s edition of the Journal of the American Medical Association, are designed for women who are in good health and have no reason to suspect their risk of developing breast cancer is above average. They represent a departure from the group’s previous recommendation that all women with an average risk of breast cancer get annual mammograms starting at age 40.

Although the American Cancer Society still endorses that course for women who prefer it, the group acknowledged that some women favor a less aggressive approach to breast cancer screening. If so, it said, they can delay their first mammogram until they are 45 and wait two years between screenings starting at age 55 without fear that doing so will put their health in jeopardy.

Either way, regular mammograms should continue as long as women have a life expectancy of at least 10 years and are good candidates for breast cancer treatment, the guidelines say.

“We moved away from a one-size-fits-all approach to something that is more personalized or individualized,” said Dr. Kevin Oeffinger, director of the Cancer Survivorship Center at Memorial Sloan-Kettering Cancer Center and lead author of the guidelines.

The coming decade will see medicine become more tailored to a patient’s particular biology, genetics and environmental influences, Oeffinger said, and “this is a step in that direction.”
The new recommendations bring the American Cancer Society into closer alignment with the U.S. Preventive Services Task Force, an independent panel of experts convened by the federal Agency for Healthcare Research and Quality.

The task force touched off an emotional debate about mammograms with its 2009 recommendation that women at average risk for breast cancer be screened only once every two years, primarily between the ages of 50 and 74. Screening may begin at age 40 if women so choose after discussing the pros and cons with their doctors, it said.

“There is substantial agreement now,” said Dr. Albert Siu, who heads the task force. “Both of these guidelines indicate that the mammogram is a good test, although it’s not perfect.”

Mammograms save lives by finding cancers that can be cured if caught at an early, treatable stage. But they also find tumors that are not destined to become dangerous if left alone, as well as tumors that can’t be stopped by surgery, radiation, chemotherapy or other drugs.

The problem is that lots of these tumors look the same on a mammogram, so doctors wind up treating them all. That leads to a certain amount of unnecessary care, which doctors call overtreatment.

Many recent studies have weighed the benefits of identifying dangerous but treatable cancers against the harm of overtreatment. In general, they have found that the younger the woman, the greater the chance that the benefits of early detection will be small while the harms of overtreatment will be large.

For instance, evidence from randomized clinical trials suggests that for women in their 40s and 50s, screening mammograms reduce the risk of dying of breast cancer by a modest 15 percent. That means 85 percent of the women in this age group who die of breast cancer would succumb to the disease whether they had a mammogram or not.

Some women see this as a good reason to cut back on mammograms. Other women would rather accept the risk of potentially unnecessary treatment to maximize the chance that a mammogram would make a lifesaving discovery. Both decisions are reasonable, Oeffinger said. In his own family, he said, he has one sister who is sticking with annual mammograms and one sister who has scaled back.

“We don’t want to make people feel wrong or guilty if they opt not to” get a mammogram every year, he said. “We support a woman going to a health care provider and having a discussion and making an informed decision.”

That type of thinking mirrors an overall shift in medicine toward tailoring care for each patient based on his or her values and needs, said Dr. Patricia Ganz, director of the Center for Cancer Prevention and Control Research at UCLA’s Jonsson Comprehensive Cancer Center.

“We can’t do cookie-cutter medicine,” she said.

Photo: A technician stands next to a machine at a breast cancer treatment center. Spectrum Health via Flickr

CDC Lauds Schools For Improving Nutrition, But Says More Can Be Done

CDC Lauds Schools For Improving Nutrition, But Says More Can Be Done

By Karen Kaplan, Los Angeles Times (TNS)

Federal health authorities give American schools good grades for improving the nutritional quality of food served in their cafeterias — but there’s still room for improvement, they said.

A report released Thursday by the Centers for Disease Control and Prevention found that 79 percent of schools served at least two kinds of non-fried vegetables and 78 percent sold at least two kinds of fruit (including 100 percent fruit juice) each day for lunch. Those figures, from 2014, represent a substantial improvement from 2006, when only 63 percent of schools had two or more quality vegetable choices and 66 percent had at least two kinds of fruit.

Schools did an even better job of meeting federal nutrition standards for whole-grain foods: 97 percent offered them every day at breakfast, and 94 percent served them every day at lunch, CDC researchers reported. (The definition of a whole-grain food used in the CDC’s School Health Policies and Practices Study was slightly different from the one used by the U.S. Department of Agriculture, which sets school lunch standards, but both emphasize use of whole grains and enriched flour.)

The third major focus of the CDC report was sodium, which the USDA says should be used more sparingly in school meals. There were signs of improvement on that score as well: Among the 55 percent of schools that prepared the meals they served in their own cafeterias, more than half have made efforts to reduce sodium. To wit, 68 percent adopted low-sodium recipes, 65 percent used herbs and other seasonings in place of salt, 54 percent opted for fresh or frozen vegetables instead of the canned variety and 52 percent said when they used canned vegetables, they picked a low-sodium product.

“School meals are healthier now than ever before,” CDC Director Tom Frieden said in a statement. “We’ve made real progress, but there is much more to do.”

Improving the quality of meals served at school would go a long way toward improving the quality of children’s diets, since students eat up to half their calories at school, according to the report. Plenty of research has shown that American kids fall short of federal guidelines for healthy eating — more than 90 percent eat too much sodium, and pretty much none eats enough vegetables. These poor eating habits put students at risk of obesity, Type 2 diabetes and other chronic health conditions.

So CDC researchers examined data gathered from food-service managers and other staff at a nationally representative sample of elementary, middle and high schools. They focused on nine specific practices to boost consumption of fruits, vegetables and whole grains and reduce consumption of sodium.

They found that 98 percent of schools had adopted at least one of those practices by 2014, and nearly three-quarters had adopted at least four. That includes the 25 percent that had embraced seven or more diet-improving practices.

The one that schools were least likely to have adopted was offering self-service salad bars. These would help schools “meet the requirements for amount and variety of vegetables offered,” yet they were found in only 35 percent of high schools, 31 percent of middle schools and 29 percent of elementary schools, according to the report.

But that could soon change. Efforts are underway to boost those figures, including a public-private partnership called Let’s Move Salad Bars to Schools, which has installed about 4,000 of them, the study authors wrote.

They also flagged a USDA-led initiative to help schools find ways to enhance flavor while reducing sodium.

But they also recognized that some schools aren’t yet equipped to embrace all of the USDA’s nutrition standards. For instance, “many schools need new kitchen equipment to store, prepare, and serve fruits and vegetables,” they wrote.

The study was published in the CDC’s Morbidity and Mortality Weekly Report.

Photo: Schools are trying to make lunch healthier. U.S. Department of Agriculture/Flickr

U.S. Birth Rate Finally Rises, Thanks To Moms In Their 30s And Early 40s

U.S. Birth Rate Finally Rises, Thanks To Moms In Their 30s And Early 40s

By Karen Kaplan, Los Angeles Times (TNS)

The nation’s birth rate rose 1 percent last year as parents in the U.S. welcomed nearly 4 million babies into the world, according to a new report from the Centers for Disease Control and Prevention.

That increase may not sound like much, but it’s the first time the birth rate has gone up in seven years.

The bump in births was courtesy of women in their 30s and 40s, the CDC data show. The birth rate jumped 3 percent for women between the ages of 30 and 39 and 2 percent for women ages 40 to 44.

Women between the ages of 25 and 29 and ages 45 and older had babies at the same rate in 2014 as they did in 2013.

The birth rate fell 2 percent for younger women in their 20s, and it plunged 9 percent for teenagers. In fact, the teen pregnancy rate hit another all-time low of 24.2 births per 1,000 young women between the ages of 15 and 19. That represents a 61 percent decline since 1991, the most recent peak for teen births, according to the report.

Overall, the birth rate — also known as the general fertility rate — was 62.9 births per 1,000 women, according to data compiled by the CDC’s National Center for Health Statistics. That added up to 3,985,924 live births in 2014.

But that wasn’t enough babies to keep the U.S. population steady, the report authors noted. Their calculations showed that a hypothetical group of 1,000 women would give birth to 1,861.5 babies over their entire lives. But in order for a generation to replace itself, those 1,000 women would need to have 2,100 babies. That hasn’t been the case since 2007, the researchers wrote.

Women in nearly all racial and ethnic groups gave birth to more babies in 2014, the CDC noted. The birth rates for whites, African-Americans and Latinas all rose by 1 percent in 2014, and it rose 6 percent for Asian-Americans. The only exceptions were Native American and Alaska Native women, whose birth rate declined 2 percent.

The birth rate for new mothers was slightly lower in 2014 than in 2013, declining by less than 1 percent. However, the rate of second births rose 1 perccent, third births increased 2 percent and the birth rate for additional children grew by 3 percent.

The total number of babies born to unmarried women rose by nearly 9,000 in 2014, up 1 percent compared with the previous year. However, the birth rate for these women actually declined by 1 percent.

The rate of preterm births — those that occurred before 37 weeks of pregnancy — also fell slightly from 9.62 percent in 2013 to 9.57 percent in 2014. In addition, 8 percent of babies born in 2014 weighed less than 5 pounds, 8 ounces and were considered to have a low birth weight, the same as in 2013.

The data in the study came from birth records in all 50 states and the District of Columbia. Ten states contributed incomplete data, and the study authors estimate that their nationwide figures account for 99.7 percent of the births that actually occurred last year.

Photo: Cuties. Aimee Ray via Flickr

Study: Many Teens Who Use E-Cigarettes Also Smoke Regular Cigarettes

Study: Many Teens Who Use E-Cigarettes Also Smoke Regular Cigarettes

By Karen Kaplan, Los Angeles Times (TNS)

Public health experts fear electronic cigarettes — with their colorful designs and array of sweet flavorings — will induce young people to start smoking. But are those fears justified? A new study from Wales offers mixed results.

Researchers found that 5.8 percent of preteens surveyed said they had used e-cigarettes, and nearly two-thirds of them had tried the battery-powered devices only once. By comparison, fewer than 2 percent of the 10- and 11-year-olds in the same survey had tried regular cigarettes, with about half of them describing themselves as current smokers, according to a report published Wednesday in the journal BMJ Open.

Although the overwhelming majority of kids in this age group had never smoked anything, there was a concerning overlap among kids who had tried electronic and traditional cigarettes. For instance, compared with those who had never smoked traditional cigarettes, those who had were 16 times more likely to have tried e-cigarettes as well. Likewise, the small number of kids who were current smokers were 17 times more likely than their nonsmoking counterparts to have used e-cigarettes too.

Both types of smoking were more popular among an older group of students between the ages of 11 and 16. In this group, 12.3 percent had tried electronic cigarettes and 1.5 percent used them at least once a month. In addition, 12.1 percent had used regular cigarettes, including the 5.4 percent who were current smokers.

Once again, researchers found a link between use of electronic and tobacco cigarettes. Four out of five of those who used e-cigarettes regularly had also tried traditional cigarettes. And compared to nonsmokers, current tobacco smokers were more than 100 times more likely to smoke e-cigarettes as well.

Still, even in this older age group, 43.2 percent of kids and teens who described themselves as regular users of e-cigarettes said they were not current tobacco smokers. And among the kids and teens who had used e-cigarettes just “a few times,” 72.1 percent were not current tobacco smokers.

The study was based on data from two different surveys — one involving 1,601 primary school students who were 10 or 11 years old and another that included 9,055 secondary school students between the ages of 11 and 16.

When all the data was put together, a pattern emerged: Electronic cigarettes were more popular than traditional cigarettes up through the ages of 15 and 16, when the kids were in school-year 11. After that, tobacco smoking became more common.

In school-years 6, 7, and 8 — when kids were between the ages of 10 and 13 — the majority of those who had tried e-cigarettes had not tried tobacco. School-year 9 (ages 13 and 14) was the tipping point, with half of those who had used e-cigarettes at least once saying they had also used traditional cigarettes at least once. Among older teens, the majority of those who had used e-cigarettes had also used tobacco.

One thing seemed quite clear from the data: Teens were not using e-cigarettes to help them kick their tobacco habit. The fact that current smokers were just as likely to use e-cigarettes as were people who had smoked just a few times “indicates that young people are not adopting e-cigarettes as an effective means of quitting tobacco,” the researchers wrote.

(c)2015 Los Angeles Times, Distributed by Tribune Content Agency, LLC

Photo Credit: AFP/Jim Watson

Study Links Disneyland Measles Outbreak To Low Vaccination Rates

Study Links Disneyland Measles Outbreak To Low Vaccination Rates

By Karen Kaplan, Los Angeles Times (TNS)

Although epidemiologists have not yet identified the person who brought measles to Disneyland, triggering an international outbreak, researchers now say that parents who refuse to vaccinate their kids are probably to blame.

Using some simple math, the researchers show that the vaccination rate among people who were exposed to the measles during the outbreak was no higher than 86 percent, and it might have been as low as 50 percent.

In order to establish herd immunity, between 96 percent and 99 percent of the population must be vaccinated, experts say.

“Even the highest estimated vaccination rates from our model fall well below this threshold,” the researchers reported Monday in the journal JAMA Pediatrics.

The team, from Massachusetts Institute of Technology and Boston Children’s Hospital, calculated the range of likely vaccination rates based on a few key data points. Based on historical data, infectious disease experts know that in the absence of any vaccination, a single person infected with measles can spread it to between 11 and 18 other people. They also know that it takes ten to 14 days for one measles case to lead to another.

The last variable in their equation is the number of people in a semi-vaccinated community who actually become infected after exposure to a single person with measles. Since this figure — called the effective reproductive number — isn’t precisely known, the researchers considered scenarios where it was as low as 3.2 and as high as 5.8.

In the best-case scenario, the vaccination rate among people who encountered the measles as a result of the Disneyland outbreak was between 75 percent and 86 percent, the researchers calculated. If the true effective reproductive number was in the middle of the range, the vaccination rate would have been between 66 percent and 81 percent. If the effective reproductive number was high, the vaccination rate had to have been between 50 percent and 71 percent, according to the study.

In other words, the only way to explain how the measles spread from a single person at Disneyland to 142 people in seven states is that a substantial number of American parents have not had their children fully immunized with the measles, mumps and rubella vaccine.

“Clearly, MMR vaccination rates in many of the communities that have been affected by this outbreak fall well below the necessary threshold to sustain herd immunity, thus placing the greater population at risk as well,” the researchers concluded.

Public health officials do keep track of vaccination rates. In California, for instance, the state Department of Public Health reported that 92.6 percent of kindergarten students had received at least two doses of the MMR vaccine in the 2014-15 school year.

So why did the study authors go to all this trouble? In an outbreak involving a major tourist destination like Disneyland, there is no single state, county or school district that can report the overall vaccination rate, the researchers wrote. As a result, mathematical modeling like this may give a clearer picture than any individual government agency.

The scope of the multistate outbreak is certainly a reflection of the anti-vaccination movement, which continues to grow despite overwhelming medical evidence that the vaccines do not cause autism or other developmental problems. In most cases, side effects are limited to pain at the injection site, fever, a mild rash or temporary swelling, according to the Centers for Disease Control and Prevention. In rare cases, children may have a severe allergic reaction to the vaccine or develop febrile seizures, joint pain, temporary arthritis or a blood disorder called immune thrombocytopenic purpura.

The outbreak “shines a glaring spotlight on our nation’s growing anti-vaccination movement and the prevalence of vaccination-hesitant parents,” the authors wrote.

In California, three state legislators have introduced a bill that would make it more difficult for parents to opt out of vaccinations by claiming a personal belief exemption. The bill, SB 277, would require children to be vaccinated against measles and other infectious diseases before enrolling in California schools.

One of the sponsors of the bill is Dr. Richard Pan, a pediatrician who represents Sacramento.

Photo: Melissa Johnson via Flickr

In Shift, FDA Says Gay And Bisexual Men Will Be Able To Donate Blood

In Shift, FDA Says Gay And Bisexual Men Will Be Able To Donate Blood

By Karen Kaplan, Los Angeles Times (TNS)

The head of the U.S. Food and Drug Administration announced Tuesday that it will change its policy on allowing gay and bisexual men to donate blood.

Men who have sex with men will be able to become blood donors one year after their last “sexual conduct,” Dr. Margaret A. Hamburg, the FDA commissioner, said in a statement. The FDA will “take the necessary steps” to implement its new policy, she said.

Previously, such men were not allowed to donate blood because of the risk that doing so might fuel the spread of HIV.

The change in policy will treat gay and bisexual men the same way as other people who are at heightened risk for HIV, Hamburg said. Scientific and epidemiological studies have demonstrated that this shift on policy is justified, she added.

The FDA will “take the necessary steps” to implement its new policy, she said.

It is not clear whether this change will appease activists who have been pressing for the right to donate blood.

Hamburg also said that the National Heart, Lung and Blood Institute has already begun to implement a blood surveillance system to make sure the nation’s blood supply remains safe after the new policy is implemented.

Photo via Wikimedia Commons

In The U.S., Gun Violence Kills Blacks At Twice The Rate Of Whites

In The U.S., Gun Violence Kills Blacks At Twice The Rate Of Whites

By Karen Kaplan, Los Angeles Times

The risk of dying from a gunshot wound is twice as high for African-Americans as it is for white Americans, according to a new study based on 11 years’ worth of data from the Centers for Disease Control and Prevention.

Between 2000 and 2010, the rate of firearm-related fatalities in the U.S. was 9.05 per 100,000 people for whites and 18.51 per 100,000 people for blacks. When factoring in the 3.38 deaths per 100,000 people of other races, the country’s overall gun-related death rate was 10.21 per 100,000 Americans, researchers reported Thursday in the journal BMJ Open.

That racial discrepancy represents an improvement from the 1990s, the researchers noted: In 1993, gun fatalities were three times more common among blacks compared to whites.

Over the 11 years of the study, at least 335,609 Americans were killed by guns. (The CDC data almost certainly understates the true toll of gun violence, the researchers wrote.) These deaths include murders, suicides and accidental shootings.

The number of deaths varied slightly per year, but the changes were small enough that they could have been due to chance, according to the research team from Columbia University and the Jacobi Medical Center in New York.

The story was the same for 41 states, where the rate of firearm-related deaths was basically stable over the 11 years. But the death rate rose in two states — Massachusetts and Florida — and fell in seven others, as well as in the District of Columbia.

California was singled out in the study for having “the most marked reduction” in the rate of gun deaths. The researchers said this could be the result of tough anti-gun laws, including eight aimed at preventing gun trafficking. They noted that the Brady Center to Prevent Gun Violence ranked California top among all states for its laws on background checks, waiting periods, restrictions on who may own a gun and consumer and child safety. (California also benefited from a reduction in homicides of all sorts, with the overall homicide rate falling 25.4 percent between 2001 and 2010.)

But the story on gun laws isn’t so simple. Massachusetts also earned high marks from the Brady Center for its gun laws, and firearm ownership there “plummeted” after a 1998 gun control law passed, the researchers wrote. Yet both violent crimes in general and homicides in particular became more common in subsequent years. (The researchers speculated that guns may have flowed into the Bay State from neighboring New Hampshire and Maine, where gun control laws are less stringent.)

Meanwhile, in Florida, only two laws on the books address illegal gun trafficking, and authorities have little discretion to reject requests for concealed weapons licenses, according to the study. So perhaps it should come as little surprise that gun deaths rose in the Sunshine State during the study period.

But that increase was seen despite the fact that the overall violent crime rate fell by one-third between 2000 and 2010, according to statistics from the Florida Department of Law Enforcement. That’s a “particularly concerning public health problem,” the study authors wrote.

Indeed, the “endemic” firearm violence in this country represents a “substantial, long-term cumulative health burden,” the researchers wrote. If present trends continue, Americans can expect to lose 336,778 lives to guns between 2011 and 2020, they calculated.

Photo: kcdsTM via Flickr

Melanoma Risk Is Higher For Flight Crews That Work At 40,000 Feet

Melanoma Risk Is Higher For Flight Crews That Work At 40,000 Feet

By Karen Kaplan, Los Angeles Times

Attention pilots and flight attendants: For your safety, please fasten your seat belts, note the location of the aircraft’s emergency exits — and be sure to apply plenty of sunscreen to reduce your risk of melanoma.

When it comes to the risks of flying, skin cancer may not be the first health hazard that comes to mind. But a new study in JAMA Dermatology says that pilots are 2.22 times more likely than folks in the general population at large to be diagnosed with melanoma. For members of the cabin crew, the risk was 2.09 times greater.

Melanoma is the sixth most common cancer in the United States, according to the National Cancer Institute. Although other types of skin cancer are diagnosed more frequently, melanoma is more likely to be fatal, the American Cancer Society says. An estimated 76,100 Americans will be diagnosed with melanoma this year, and about 9,710 will die from it.

Dozens of studies have examined melanoma risk in flight crews, since working at 40,000 feet means greater exposure to cosmic rays and ultraviolet radiation. For the new study, researchers from the University of California, San Francisco combed through data on 266,431 participants in 19 published studies to see whether the danger was real — and if so, how big it was.

They found that for pilots and flight attendants, the risk of developing melanoma was more than double the risk seen in people who worked on the ground. However, only pilots faced an increased risk of death from the cancer — their mortality risk was 83 percent greater than for those in the general population. (For those who worked in the main cabin, the risk of dying from melanoma was actually 10 percent lower.)

The study authors noted that exposure to cosmic radiation is not likely to be a factor for melanoma. Many studies have measured the cosmic radiation that finds its way into a plane, and the amount is “consistently below the allowed dose limit of 20 mSv/y,” or 20 millisieverts per year. (A typical American is exposed to about 3.6 mSv per year, according to this report from the Environmental Protection Agency.)

UVB radiation probably isn’t the culprit either, since fewer than 1 percent of this radiation can penetrate aircraft windshields, the researchers wrote.

UVA, on the other hand, can penetrate glass, and the higher a plane flies, the more intense UVA radiation becomes. When planes fly above clouds or snow-covered mountains, they are exposed to even more UVA reflected from below, the researchers wrote. Studies of cells in lab dishes and in animals show that UVA damages DNA, causing the mutations that can lead to cancer.

It’s possible that when they are on the ground, pilots and flight attendants are bigger fans of activities that would increase their risk of melanoma, such as frequenting tanning salons. So far, there’s no hard data suggesting that this is the case, the UC San Francisco researchers wrote.

Instead, they noted that multiple studies have found that the more hours a member of the flight crew spends in the air, the more likely he or she is to be diagnosed with melanoma.

AFP Photo/Saul Loeb

Interested in health news? Sign up for our daily email newsletter!

Overweight And Obese Kids Are In Denial About Their Weight, CDC Says

Overweight And Obese Kids Are In Denial About Their Weight, CDC Says

By Karen Kaplan, Los Angeles Times

New government data suggest a nonmedical cause of America’s childhood obesity crisis: denial.

According to the Centers for Disease Control and Prevention, 48 percent of obese boys and 36 percent of obese girls think their weight is “about right.” Among kids and teens who were merely overweight, 81 percent of boys and 71 percent of girls also judged their weight to be “about right.”

Those figures are based on interviews with American children who were between the ages of 8 and 15 during the years 2005 through 2012. As part of the CDC’s ongoing National Health and Nutritional Examination Survey, they had their height and weight measured and they answered questions from interviewers. Among them: “Do you consider yourself now to be fat or overweight, too thin or about the right weight?”

Overall, 30.2 percent of the kids gave an answer that wasn’t in line with their actual body mass index, according to the report from the CDC’s National Center for Health Statistics. That corresponds to about 9.1 million American kids who have the wrong idea about their weight status.

Roughly 20 percent of these kids had a healthy weight but mistakenly thought they were either too thin or too fat. But the overwhelming majority were low-balling their weight.

Boys were more likely than girls to think their extra pounds were normal, the CDC researchers found. In addition, Mexican American kids were more likely to suffer from “weight status misperception” compared with African-Americans, who in turn were more likely to have it than white kids. The prevalences for the three groups were 34.4 percent, 34 percent. and 27.7 percent, respectively. (Figures for Asian Americans weren’t reported.)

Children between the ages of 8 and 11 were more likely to get their weight status wrong (33 percent) than kids between the ages of 12 and 15 (27 percent). Also, the higher a child’s family income, the less likely he or she was to have the wrong idea about his or her body weight.

All of this matters because overweight and obese kids aren’t likely to slim down if they think their weight is just fine. Kids who are overweight or obese are likely to carry those extra pounds with them into adulthood, leading to a host of health problems that add up to $19,000 in extra medical costs over a lifetime.

“Understanding the prevalence of weight status misperception among U.S. children and adolescents may help inform public health interventions,” the CDC researchers wrote.

By definition almost all kids — those between the 5th percentile to just under the 85th percentile — are considered to have a “healthy weight.” Only kids with a BMI that puts them at or above the 85th percentile to just under the 95th percentile are officially “overweight,” and those at or above the 95th percentile are classified as “obese.” In addition, kids below the 5th percentile are considered “underweight.”

(For adults, people with a BMI between 18.5 and 24.9 are considered “normal,” people between 25 and 29.9 are “overweight,” people above 30 are “obese” and people below 18.5 are “underweight. You can use the NIH’s online calculator to learn yours: http://www.nhlbi.nih.gov/guidelines/obesity/BMI/bmicalc.htm.)

Researchers documented a similar problem in adults back in 2010, though they called it “body size misperception” in a study published in the Annals of Internal Medicine.

Parents can also be wrong about the weight status of their kids. A 2012 study in the Archives of Pediatrics & Adolescent Medicine reported that about two-thirds of low-income mothers incorrectly believed their toddlers were too small.

Last month, researchers from the University of California, San Diego, and Brown University reported that 31 percent of parents whose children were being treated in a hospital obesity clinic thought their kids’ health was “excellent” or “very good.” That study was published in the Journal of the Academy of Nutrition and Dietetics.

Photo: USDAGov via Flickr

Interested in health news? Sign up for our daily email newsletter!

Nature Journal Retracts STAP Stem Cell Studies After Finding More Errors

Nature Journal Retracts STAP Stem Cell Studies After Finding More Errors

By Karen Kaplan, Los Angeles Times

After months of controversy, scientists have retracted two high-profile studies that purported to demonstrate a quick and simple way of making flexible stem cells without destroying embryos or tinkering with DNA.

“Several critical errors have been found in our Article and Letter,” the scientists wrote in a retraction statement issued Wednesday. “We apologize for the mistakes.”

The two reports described a new way of reprogramming blood cells so that they would revert to a developmentally primitive state and be capable of growing into any type of cell. Researchers from Japan and the United States said they accomplished this feat by soaking the cells in an acid bath for 30 minutes and then spinning them in a centrifuge for 5 minutes.

The resulting stem cells — dubbed stimulus triggered acquisition of pluripotency, or STAP — had the hallmarks of embryonic stem cells. When the researchers injected them into developing mice, the STAP stem cells grew into heart, bone, and brain cells, among others, the research team reported in January.

Scientists in the field of regenerative medicine were giddy at the prospect of using the cells to grow new insulin-producing cells for people with Type 1 diabetes or central nervous system cells for people with spinal cord injuries, to name a few examples. Since these replacement tissues would be generated from a patient’s own cells, researchers believed they would not prompt the immune system to attack, eliminating the need for patients to take immune-suppressing drugs.

But it didn’t take long for some researchers to suspect that STAP stem cells were too good to be true. Critiques posted online gained more currency when labs began reporting that they weren’t able to replicate the experiments. Then one of the senior researchers who worked on both of the studies called for the papers to be withdrawn until the results could be independently verified.
In April, the Japanese research institute where most of the work was conducted accused study leader Haruko Obokata of intentional misconduct.

Investigators at RIKEN said Obokata had manipulated two images of DNA fragments to make the results of her experiments look better than they really were. They also found that data were handled inappropriately and that two of the images in the study were duplicates.

Investigators at the journal Nature cited five additional errors that were not included in the RIKEN investigation. Figures and images in the studies were improperly labeled, and one of the images was digitally enhanced, according to the retraction statement. They also identified “inexplicable discrepancies” in the cells of mice that were injected with STAP stem cells.

“These multiple errors impair the credibility of the study as a whole and we are unable to say without doubt whether the STAP-SC phenomenon is real,” the scientists wrote in the retraction. “Ongoing studies are investigating this phenomenon afresh, but given the extensive nature of the errors currently found, we consider it appropriate to retract both papers.”

All of the researchers who contributed to both papers have agreed with the decision to retract them, according to an editorial published by the journal.

Photo: UC Irvine via Flickr

Interested in national news? Sign up for our daily email newsletter!

Study: Price Tag Of Autism In The U.S. Exceeds $236 Billion Per Year

Study: Price Tag Of Autism In The U.S. Exceeds $236 Billion Per Year

By Karen Kaplan, Los Angeles Times

Good health is priceless, but autism spectrum disorders can be very expensive. A new study estimates that the lifetime cost of being diagnosed with autism in the United States is somewhere between $1.43 million and $2.44 million.

Either of those totals is enough to give most people sticker shock. The figure at the low end of the range is for people on the autism spectrum who don’t have intellectual disabilities. The higher tally is for people who do, according to a study published Monday by the journal JAMA Pediatrics.

To put it into perspective, $1.43 million is more than enough to put five students through Harvard without any scholarships, grants or other discounts, or to send five people into space via Virgin Galactic. For $2.44 million, you could buy Beau Bridges’ 6,800-square-foot home in the Los Angeles suburb of Hidden Hills.

When it comes to autism expenses, what that money buys depends on the age of the person with the diagnosis. For children, it pays for special-education services, the researchers found. These include early-intervention treatments for children under the age of 3 that can put them on a trajectory for a more successful life. Another big chunk of money represents the lost productivity of parents who care for children with autism.

For adults, the biggest costs were tied to living expenses, especially in facilities that require lots of staff. That was followed by medical expenses and the lost productivity of people on the autism spectrum.

The study authors relied on estimates from the Centers for Disease Control and Prevention to estimate that there are 3,540,909 Americans with some form of autism. Assuming that 40 percent of them have an intellectual disability, the total cost of autism in the U.S. is on the order of $236 billion per year.

If the proportion of people with an intellectual disability is more like 60 percent, the total annual cost jumps to $262 billion. That’s more than the U.S. Treasury paid in interest on the national debt in the entire fiscal year that ended on Sept. 30, 2013.

The study also tallied the expenses for people with autism in Britain. Even though both countries have “different approaches to health care provision,” the total costs were remarkably similar, the researchers wrote.

These are huge sums of money, and it’s time for people to start thinking in a different way, according to a pair of experts from the A.J. Drexel Autism Institute at Drexel University in Philadelphia. Instead of focusing on the “costs of helping needy people,” the outlays should be seen as “investments in building stronger communities,” they wrote in an editorial that accompanied the study.

“Adopting an investment perspective also means taking a long view on life course outcomes,” they wrote. “We need a Framingham (Heart) Study for autism spectrum disorders, especially to track risks and outcomes into middle and later adulthood.”

AFP/Jean-Philippe Ksiazek

Risk Of Depression Is Nearly Twice As High For Unemployed Americans

Risk Of Depression Is Nearly Twice As High For Unemployed Americans

By Karen Kaplan, Los Angeles Times

Unemployment takes a significant toll on the mental health of workers, especially those who have been out of their jobs for at least 27 weeks — what the Bureau of Labor Statistics considers the “long-term unemployed.”

The longer a person has been out of work, the greater the chances that he or she will develop a clinical case of depression, according to data from a new Gallup poll. Among Americans who have been without a job for three to five weeks, 10 percent said they were depressed or were being treated for depression. That figure rose to 17 percent for those who have been out of work for six months to one year. Among people who have crossed the one-year mark, 19 percent were battling depression, the poll found.

Overall, unemployed Americans were nearly twice as likely as working Americans to be depressed — 12.4 percent versus 6.4 percent, according to Gallup.

The poll found that 5.6 percent of people with full-time jobs said they were depressed or were being treated for depression. They were joined by 8 percent of people who worked part time and weren’t seeking full-time jobs. Among those stuck with part-time gigs because they couldn’t find full-time work, 10.3 percent said they were depressed.

But the situation was worse for people without any work at all. The survey found that 12.3 percent of the short-term unemployed (who had been jobless for fewer than 27 weeks) were depressed, as were 18 percent of the long-term unemployed.

Those feelings may help explain why people become increasingly pessimistic about their prospects for finding a job the longer they’ve been out of work. Among people who have been unemployed for five weeks or fewer, about 70 percent think they’ll get a job in the next four weeks. But among people who have been unemployed for at least a year, only 30 percent believe a job offer will come their way in the next four weeks, the poll found.

It’s not hard to see how being unemployed could lead to depression. But the Gallup report notes that the reverse may be true as well — that people who are depressed could have more trouble finding a new job.

Either way, the poll results could be useful to those who design programs aimed at helping Americans get back to work by highlighting the need for taking their psychological and social well-being into account, according to the report.

The Bureau of Labor Statistics says 9.8 million Americans were out of work in May, including 3.4 million who were considered long-term unemployed.

The data are based on interviews with 356,599 Americans who were surveyed in 2013 for the Gallup-Healthways Well-Being Index. That sample included 18,322 who were unemployed at the time of their interview. The poll results were published Monday.

Photo: .v1ctor Casale via Flickr

CDC Says Illinois Man Who Met With MERS Patient Was Not Infected After All

CDC Says Illinois Man Who Met With MERS Patient Was Not Infected After All

By Karen Kaplan, Los Angeles Times

Health officials at the Center for Disease Control and Prevention said Wednesday an Illinois man did not contract MERS from an infected business associate after all.

The case, announced May 17, was believed to have been the first instance of human-to-human transmission of the Middle East Respiratory Syndrome coronavirus on U.S. soil. But upon further analysis, it wasn’t, said Dr. David Swerdlow, the epidemiologist who is leading the CDC’s response to MERS.

Initial blood tests “indicated the possibility that the unidentified Illinois resident had been previously infected with MERS-CoV,” Swerdlow said in a statement. But now that the results of a more definitive test are in, the CDC has concluded the man was never infected.

Public health officials investigated the Illinois man after a health care worker from Saudi Arabia was diagnosed with MERS in Munster, Indiana. The Indiana patient was the first person with a confirmed case of MERS in the U.S.

The Illinois man aroused suspicion because he had two business meetings with the Indiana patient in the days before he was hospitalized. The two men shook hands and sat face-to-face for more than half an hour during their first meeting, Swerdlow told reporters May 17. The second meeting was shorter.

The Illinois man never felt sick and never sought medical care. But public health officials decided his contact with the Indiana patient was close enough to warrant testing for MERS antibodies, which are made by the immune system to fight off an infection.

Officials performed three types of blood tests. Two of them — an enzyme-linked immunosorbant assay (ELISA) and an immunofluorescent assay (IFA) — seemed to indicate the presence of MERS antibodies. Those preliminary results prompted Swerdlow to announce the Illinois case May 17, which appeared to be the first homegrown case of MERS in the United States.

In the days since then, officials completed a more time-consuming blood test called a neutralizing antibody assay. With all of the results in and carefully interpreted, CDC officials now say the Illinois man was never infected with MERS.

“It is our job to move quickly when there is a potential public health threat,” Swerdlow said Wednesday. “Because there is still much we don’t know about this virus, we will continue to err on the side of caution when responding to and investigating cases of MERS in this country.”

The Indiana patient has been released from the hospital and is doing well. A second patient in Florida has also fully recovered and was discharged from the hospital this month. That man is also a health care worker who had recently traveled to Saudi Arabia. The two cases are not linked, according to the CDC.

MERS is a respiratory disease that is thought to have originated in camels before spreading to people. It was first detected in Saudi Arabia in 2012. Humans have no natural defense against the virus, which has killed about 30 percent of the people known to be infected with it.

As of Wednesday, the World Health Organization has announced 635 laboratory-confirmed cases of MERS. Among those patients, 193 have died.

So far, there is no evidence that MERS spreads easily from person to person. There have been some cases of transmission between close contacts, such as patients and the health care providers who care for them.

Photo: Striatic via Flickr

Way Too Many Doctors Are Prescribing Antibiotics In Error, Study Says

Way Too Many Doctors Are Prescribing Antibiotics In Error, Study Says

By Karen Kaplan, Los Angeles Times

About 7 in 10 patients who go to a doctor seeking treatment for acute bronchitis wind up leaving their appointment with a prescription for an antibiotic, according to a new study in the Journal of the American Medical Association. That’s a problem, the study authors say, because the ideal prescription rate should be 0 percent.

That’s right, a big fat zero. Zip. Nada. Zilch.

More than 40 years of clinical trials have demonstrated that antibiotics do not help patients with acute bronchitis. On top of that, the Centers for Disease Control and Prevention have been emphasizing this fact for the last 15 years, as has the Healthcare Effectiveness Data and Information Set for nearly 10 years, the JAMA report says.

But it doesn’t seem that the message has gotten through to doctors. Not only are physicians continuing to write prescriptions for the medications, but they also did it more frequently in 2010 than they did in 1996, the study authors found.

Researchers from Brigham and Women’s Hospital in Boston analyzed data from two national surveys that track patients who are seen in medical clinics (including pediatric practices) or in hospital emergency departments. Records between 1996 and 2010 identified 3,153 patients whose only medical complaint was acute bronchitis, a respiratory disease that makes people cough and is over in less than three weeks. (Patients who also had other problems, including chronic pulmonary disease or infectious diseases, were excluded from the analysis.)

During the entire study period, 36 percent of those patients got a prescription for an extended macrolide, a group that includes such workhorses as azithromycin and erythromycin. Another 35 percent got an Rx for a broad-spectrum antibiotic, including fluoroquinolones, aminopenicillins and cephalosporins. Altogether, the antibiotic prescription rate was 71 percent, the researchers found.

Use of the broad-spectrum drugs fell slightly during the study period, though the difference wasn’t large enough to be statistically significant, the researchers reported. However, there was a distinct rise in the use of extended macrolides, with the prescription rate increasing from 25 percent between 1996 and 1998 to 41 percent between 2008 and 2010, according to the study.

Over the 14 years of the study, 72 percent of doctors in primary care practices gave their patients some kind of antibiotic for acute bronchitis. So did 69 percent of the doctors treating patients in hospital emergency departments. Both groups of physicians seemed to lay off the drugs a little bit between 1999 and 2001, but that trend didn’t last.

The study authors sounded somewhat exasperated about the fact that a figure that should be 0 percent was actually 71 percent. “Avoidance of antibiotic overuse for acute bronchitis should be a cornerstone of quality health care,” they wrote.

The CDC and other health groups are concerned that the overuse of antibiotics is helping to fuel the rise in drug-resistant pathogens, including strains of tuberculosis, Staphylococcus aureus and E. coli. This month, one of the World Health Organization’s top officials for health security warned that “the world is headed for a post-antibiotic era, in which common infections and minor injuries which have been treatable for decades can once again kill.”

“Effective antibiotics have been one of the pillars allowing us to live longer, live healthier and benefit from modern medicine,” said Dr. Keiji Fukuda, who led a report on the state of antimicrobial resistance around the world. “Unless we take significant actions … the implications will be devastating.”

Photo via Flickr

Illinois Man Found To Carry Antibodies To Counter MERS

Illinois Man Found To Carry Antibodies To Counter MERS

By Karen Kaplan, Los Angeles Times

The U.S. Centers for Disease Control and Prevention have identified an Illinois man who appears to be the first homegrown case of MERS in the United States.

The man does not have an active case of Middle East respiratory syndrome, CDC officials said Saturday. But blood tests show that his immune system has made antibodies to fight the MERS coronavirus — an indication that he has been infected.

Unlike the two other U.S. residents who have been diagnosed with MERS — one in Indiana and one in Florida — the Illinois man has not traveled to the Middle East, where the virus first appeared in 2012. However, he met with the Indiana patient twice and had close contact with him during those visits, according to the CDC.

The Illinois man, whose identity was not released, was never sick enough to seek medical care. Health officials tested him as part of their investigation into all the known contacts of the Indiana patient, a health-care worker who returned from Saudi Arabia four days before he was admitted to Community Hospital in Munster, Ind., on April 28.

Health officials will reach out to people who have been in close contact with the Illinois man to “notify, test and monitor” them, according to the CDC.

“It’s possible that as the investigation continues others may also test positive for MERS-CoV infection but not get sick,” Dr. David Swerdlow, the epidemiologist in charge of the CDC’s MERS response, said in a statement.

Local health officials have been keeping tabs on the Illinois man since May 3. His blood test results showing MERS antibodies were reported to the CDC on Friday night.

As of Saturday, the Illinois man was “feeling well,” the CDC said.

So was the Indiana patient, who was identified May 2 as the first case of MERS in the U.S. He has been discharged from the Munster hospital and is “fully recovered,” according to the CDC.

The Florida patient is also a health-care worker who traveled from Saudi Arabia to Orlando to visit relatives there. He began to experience flulike symptoms on a plane from Jidda to London on May 1. He was admitted to a hospital May 8, where he is isolated and “doing well,” the CDC says.

There is no link between the Indiana and Florida patients.

At this time, there is no need for Americans wishing to visit the Arabian Peninsula to cancel their plans, the CDC says. Travelers should monitor their health while overseas and once they return, according to the agency.

“This latest development does not change CDC’s current recommendations to prevent the spread of MERS,” Swerdlow said. “If new information is learned that requires us to change our prevention recommendations, we can do so.”

Photo via Flickr