Tag: growth
First-Quarter Productivity Decline Is A Grim Economic Portent

First-Quarter Productivity Decline Is A Grim Economic Portent

The Bureau of Labor Statistics today released its first estimate of productivity in the first quarter. It showed productivity falling at a 0.8 percent annual rate. This is really bad news.

Productivity matters a lot for both inflation and living standards. In the five years from 2019 to 2024, productivity growth averaged 1.9 percent annually. That is up from 1.1 percent annually in the decade before the pandemic.

The faster rate of productivity growth most immediately translates into lower inflation. As a first approximation, inflation will be equal to nominal wage growth minus productivity growth. If nominal wages are growing at a 4.0 percent annual rate, and productivity is rising at a 1.9 percent annual rate, inflation will be roughly 2.1 percent. (We could have some redistribution from profits to wages, reversing the rise in profit shares in the pandemic, but we’ll leave that one for another time.)

To take the other side of the same coin, real wages can sustainably increase at the rate of productivity growth. The 1.9 percent rate of productivity growth meant that real wages could rise at roughly a 1.9 percent annual rate. By contrast, the 1.1 percent rate for the decade before the pandemic could only support a 1.1 percent annual rate of real wage growth. Over the course of a decade that’s the difference between a 20 percent rise in real wages and an 11 percent rise.

For these reasons, the productivity slowdown reported for the first quarter is a big deal. Having said this, it is necessary to throw out two important caveats about the first quarter productivity data.

First these data are subject to revisions. Both the numerator or this equation (output) and the denominator (hours) will be revised in subsequent months. When we have the data in June, after two rounds of revisions, the picture may look very different.

The other important caveat is that productivity data are notoriously erratic. For example, productivity shrank at a 2.4 percent annual rate in the fourth quarter of 2015. It rose at a 1.7 percent annual rate in the first quarter of 2016. Reversals like this are very common. This means that even if the first quarter weakness holds up through revisions to the data, it is entirely possible that we see a sharp reversal in the second quarter or the second half of 2025.

First and foremost, the negative productivity growth reported for the first quarter should be seen a warning. We have pursued a number of policies that are likely to do both near-term and lasting damage to the economy. Tariffs, mass deportations, reckless layoffs in the federal government, and slashing research budgets, are all likely to hurt economic growth. Much of the impact will only be seen over the long term, but some may already be showing up in the data.

For example, if ships from China are not coming due to 145 percent tariffs, we will see fewer workers unloading goods, at the ports, fewer truck drivers transporting goods, and before long, empty shelves at the stores. The firings at the federal level, coupled with layoffs elsewhere due to cutbacks of federal support, could show up in higher unemployment rates.

The fall in productivity reported for the first quarter should be taken as a flashing yellow. Maybe all will be okay, but it’s not a good start.

Dean Baker is an economist, author, and co-founder of the Center for Economic Policy and Research. His writing has appeared in many major publications, including The Atlantic, The Washington Post, and The Financial Times. Please consider subscribing to his Substack Dean Baker.

Reprinted with permission from Substack.

Which States Have The Most Job Growth Since The Recession?

Which States Have The Most Job Growth Since The Recession?

By Jake Grovum, Stateline.org (TNS)

Although the nation’s unemployment rate has been around a seven-year low of about 5.4 percent, job growth among the states has been uneven, with several showing only meager gains more than five years removed from the depths of the Great Recession.

A Stateline analysis of states’ employment data shows that while all states have added jobs since their economies hit their nadir during the recession, some have added far fewer than others. Ten states (Alabama, Arkansas, Maine, Mississippi, Missouri, New Hampshire, New Jersey, New Mexico, Pennsylvania and West Virginia) have seen total employment grow 5 percent or less compared to their lowest points, according to the analysis of Bureau of Labor Statistics data.

On average, employment has increased 8 percent among all 50 states and the District of Columbia since each one’s individual nadir.

To calculate job growth, Stateline identified each state’s lowest level of employment since January 2008 (the recession officially began in December 2007), and compared that figure to the state’s March 2015 employment level, the most recent number available at the time of writing. The result is a state-by-state measurement of job growth since the recession.

Maine and West Virginia have seen the least growth, with employment increasing less than 3 percent in those states since they hit their lowest levels in 2010. Mississippi, Missouri and New Mexico have experienced less than 4 percent growth. In 21 states, employment has increased less than 7 percent.

But in other states, employment has bounced back strongly: In 14, employment has increased 10 percent or more since their low points.

North Dakota has led the way thanks to its oil boom. Employment there has jumped more than 28 percent since April 2009, the earliest low point of any state.

Other top performers are Texas and Utah, where employment has increased more than 15 percent since December 2009 and February 2010, respectively. Next are California and Colorado, where employment is up more than 13 percent since their lowest points in early 2010.

In raw numbers, the 50 states and the District have added nearly 12 million jobs since each one’s lowest employment level.

The most populous states — California, Florida, New York and Texas — dominate the growth in sheer numbers.

Michigan may be the biggest success story. By many economic measures, including employment rate and overall job loss, Michigan fell further than any other state during the recession. But Michigan has added 417,900 jobs since its low point in March 2010, placing it fifth in overall employment growth. Employment in the state is up nearly 11 percent, to 4,246,400 in March — about 10,000 more jobs than it had in January 2008.

Twenty-one states hit their Great Recession employment low in February 2010, according to Stateline’s analysis. The second most common low point was December 2009, which was the nadir for nine states. Seven states saw employment hit bottom in January 2010.

Every state plus the District experienced its lowest point in employment between April 2009 and September 2010. The District and North Dakota bottomed out first, while Arizona, Nevada, New Jersey and New Mexico were the last four to hit bottom in late 2010, nearly three years after the recession began.

Photo: Maine has had less than 3 percent growth since 2010. LL Bean is the flagship retailer of the state. StormFall via Flickr

5 Ways Democratic Presidents Kick Republican Butt

5 Ways Democratic Presidents Kick Republican Butt

At the 2012 Democratic National Convention, Bill Clinton had some good news for his fellow Democrats.

“You see, we believe that ‘we’re all in this together’ is a far better philosophy than ‘you’re on your own.’ It is. So who’s right?” he asked the crowd. “Well, since 1961, for 52 years now, the Republicans have held the White House 28 years, the Democrats, 24. In those 52 years, our private economy has produced 66 million private sector jobs.

“So what’s the job score? Republicans, 24 million; Democrats, 42 [million],” said Clinton, to a roar of cheers and applause.

Since September of 2012, more than 6.5 million more new jobs have been created, according to the Bureau of Labor Statistics. And in 2014, we had the best year of job creation this century –which meant more net jobs had been created under President Obama in 6 years than in 12 years of two president Bushes.

Still, Democrats apparently need to be reminded that their policies work better.

“We’ve seen 11 million jobs created, best job growth since the ’90s, best job growth in manufacturing since the ’90s; steepest drop in the unemployment rate in 30 years; deficit cut by two-thirds; over 10 million people with health insurance that didn’t have it before,” President Obama reminded Democrats at the House Democratic Issues Conference in January. He summed up the successes: “There is no economic metric by which we are not better off than when I took office.”

He credited these steady improvements to what he has been calling “middle-class economics.” Noting that liberal economic policies work, he added, “That’s been the history of this country.”

But who is going to trust Democratic presidents when it comes to assessing the success of Democratic presidents?

Sean McElwee, a research associate at Demos, has looked at the studies that have compared the records of recent presidents from both parties and summed up some of the findings in a recent post for Al Jazeera America. And what he’s found echoes the message Clinton and Obama gave to their fellow Democrats.

Here are five ways Democrats in the White House make America better.

1. Everyone does better under Democrats.
No matter who you are — white, black, Asian, Latino, rich, poor — you do better under Democrats, according to political scientists Zoltan Hajnal and Jeremy Horowitz. Wages grow more and poverty goes down more, along with the unemployment rate. Research from Princeton’s Larry Bartles finds that the gains for poorer Americans are specifically related to Democratic policies that favor the working class.

McElwee notes that while conservatives argue their policies encourage growth, they’re actually just shifting money to those who already have it:

“The evidence demonstrates that, on the contrary, Democrats make the pie bigger for everyone, while Republicans redistribute income toward the rich and whites,” he writes, citing a study by political scientist Nathan Kelly. When Republicans argue for lower taxes and regulation, all they are advocating is spreading more wealth to the wealthy, at the expense of the larger economy. They are the true redistributionists — in a regressive direction.

2. Minorities — especially — prosper when a Democrat is in the White House.
Republicans need to win a larger share of the minority vote in order to win the presidency but McElwee says they’ll only succeed “if voters remain unaware of their actual record.”

In their study “Racial Winners and Losers in American Party Politics,” Hajnal and Horowitz came to a straightforward conclusion. “Put simply: However measured, blacks made consistent gains under Democratic presidents and suffered regular losses under Republicans,” the authors found — and based on more limited data, those findings are also true for Latinos and Asians.

When a Democratic president has to deal with a Republican-dominated Congress, the benefits for blacks — and likely other minority groups — decrease.

3. Democrats are more fiscally responsible than Republicans.
The only way to shrink the deficit is to grow the economy — and because Democratic presidents are better at that, they’re also better at balancing the budget.

“In a study published last July, Princeton economists Alan Blinder and Mark Watson found that from 1947 to 2013, gross domestic product, employment, corporate profits and productivity grew faster under Democrats than Republicans,” McElwee writes. “The authors also noted that unemployment and deficits shrank and the economy climbed out of recession in less time under Democrats.”

McElwee also credits Democratic policies with creating superior “market conditioning.” Because Democrats prosecute wage theft, support unions, encourage reproductive rights, and provide a safety net that encourages entrepreneurship, incomes rise. The trickle-up policies pursued by the right, however, dampen the economy and hurt growth.

And that’s not a Democratic president saying that. It’s Standard & Poor’s Financial Services and the S&P stock index.

4. Democrats get “lucky.”
This is where you scream, “Correlation doesn’t equal causation.” Sure, we have lots of data that show everyone does better when a Republican isn’t in the White House, but how do we know the economy isn’t improving just at the mere wish that Reagan will be reincarnated?

Blinder and Watson are careful to note that about “half these benefits [are owed] to productivity shocks, consumer expectations, and favorable economic conditions.” They don’t want to fully credit Democrats, despite the evidence that a shift to conservative policies that “immiserate the population” have led to a 40-year slump for workers.

The middle class is still suffering, especially compared to the halcyon days of the mid-20th century, when workers’ share of income was actually growing faster than the share of the super rich. And for this reason, liberals tend not to want to trumpet their own successes, knowing there are many miles to go before we begin to reverse the damage done to the economy by right-wing policies.

But this modesty could cost Democrats the White House.

“If liberals are those who can marshal an impressive amount of evidence for their case and refuse to deploy it, then Alan Blinder and Mark Watson are most certainly liberals,” McElwee told me.

He notes that Republicans’ belligerent foreign policy and lack of support for education are variables that need to be factored in. “Consumer confidence is stronger under Democrats, this makes sense, as a recent cross-national study indicates that left-leaning parties are very good for firm growth [Blinder and Watson find that the stock market grows faster under Democrats]. There are therefore plausible reasons to believe that what Blinder and Watson consider ‘random’ [variables] are not [random].”

5. The Republican Party is a “patronage machine” for whites and the 1 percent.
In the aftermath of the civil rights movement, conservatives recognized that a “color-blind” society required more subtle forms of worrying about the plight of the white majority. The reborn far right had been trounced under Barry Goldwater’s opposition to the Civil Rights Act. But Richard Nixon’s more subtle “Southern Strategy” pulled in many former Democrats who had supported segregation. And the movement became increasingly conservative throughout the 70s, as big business united with religious right-wingers, in pursuit of their shared goals of cutting taxes and taking over the Supreme Court.

Despite anti-“taker” rhetoric, Republicans love government benefits. Their favored benefits — tax breaks for the wealthy, the mortgage interest tax deduction, and subsidies to help rich people buy health insurance — just happen to benefit whites disproportionately.

And even though white people do better under Democratic presidents, McElwee suggests they may prefer Republican policies due to a phenomenon known as “last-place aversion.”

“Among white voters, racial bias is strongly correlated with lower support of redistributive programs,” McElwee writes. “For example, research shows that opposition to welfare is driven by racial anger. Approximately half of the difference between social spending in the U.S. and Europe can be explained by racial animosity.”

Racial bias may explain why so many Americans are willing to vote against their own interests.

Regardless, Democrats have failed to make the case to the white and rural voters who show up in midterm elections that they don’t benefit by voting Republican. Policies such as paid sick leave, free community college, and universal pre-K help make these contrasts more vivid. But the Democrats must start making the case now — as we face an election that will determine the makeup of the Supreme Court for a generation — that Democrats have proven they’re consistently, historically, reliably better for America.

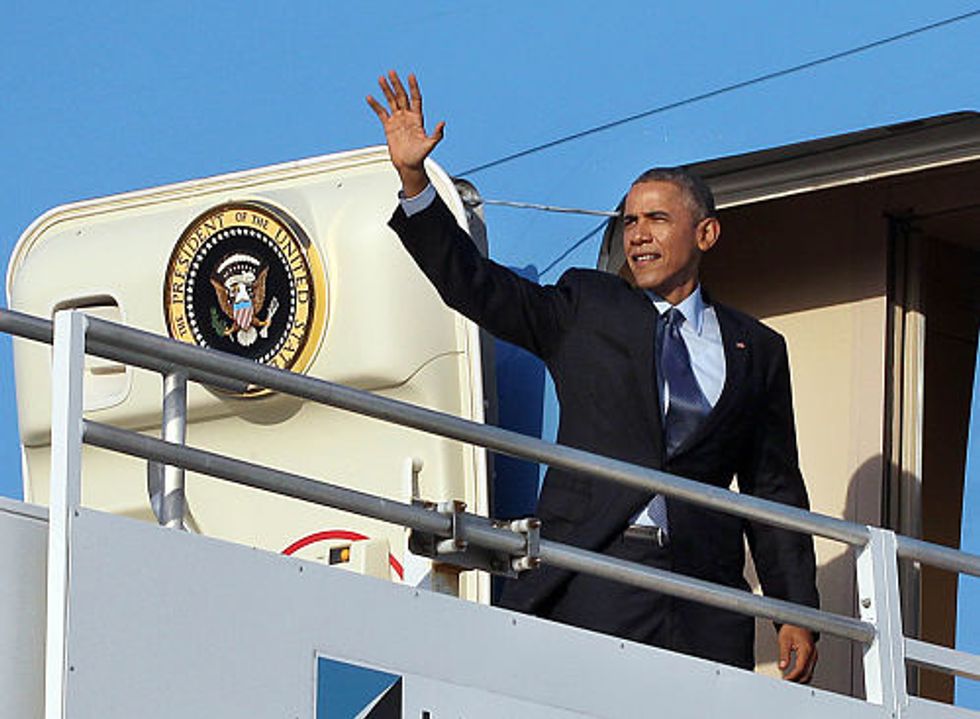
Photo: President Obama waves from Air Force One as he leaves Miami after a town hall meeting on immigration at Florida International University in Hialeah, FL, on Wednesday, Feb. 25, 2015. (Pool photo by Pedro Portal/Miami Herald/TNS)

5 Keys To The U.S. Economy To Watch In 2015

5 Keys To The U.S. Economy To Watch In 2015

By Kevin G. Hall, McClatchy Washington Bureau (TNS)

WASHINGTON — Ask five economists what they expect for 2015 and you’re likely to get scores of answers. Don’t fret: We’ve narrowed it down to five pivotal issues that will decide just how strong the U.S. economy grows this year.

1. Interest rates

Sometime this year the Fed is likely to raise rates, which will ripple through all sorts of lending.

By the middle of the year, “we expect the unemployment rate will be closing in on 5.5 percent and the inflation rate will be between 1.5 percent and 1.75 percent but on the rise,” said Chris Varvares, senior managing director of Macroeconomic Advisers in St. Louis.

The Fed meets eight times a year, and the most likely time frame for a rate hike is its fourth meeting, set for June, Varvares said, though it could raise rates by a quarter of a percentage point in any or all of the four meetings that will come after. The pace could become faster in 2016. Since long-term loans in part take their cue from this Fed rate, it will become more expensive to borrow to buy a home or car. That might slow economic growth.

“The expansion has seemed to be so tentative, even fragile, that you have to be at least a little concerned about what the response will be to rising rates,” said Varvares. “If the rise in rates were to slow the increase in home prices or knock down the stock market, then it would be a negative for consumer spending. And that’s pretty much the foundation of economic growth.”

2. Oil prices

The drop in oil prices has been akin to a massive and welcome tax break for consumers. The AAA Motor Club estimates Americans spent $14 billion less on fuel last year than they did in 2013.

“It would not be surprising for U.S. consumers to save $50 (billion) to $75 billion on gasoline in 2015 if prices remain low,” said Michael Green, a AAA spokesman.

But there are risks for the economy in the plummeting prices. For one, energy companies are almost certain to cut back their drilling plans, with impacts on hiring and equipment coming quickly.

“I fear the recent plunge in oil prices will prove most damaging to the economy in the near-term as capital spending budgets are scaled back,” said Mark Vitner, a senior economist at Wells Fargo Securities in Charlotte, N.C. “The benefits from lower gasoline prices will take longer to show up.”

That will have a negative effect on the nation’s gross domestic product, he suggested.

That’s because the five largest energy-producing states — Texas, North Dakota, Oklahoma, New Mexico and Colorado — accounted for about 25 percent of the growth in GDP last year. Their outsized contributions to growth will slow; the rise in consumer spending from lower gasoline prices will offset some of that but not all.

“We may see overall growth slow in ways that are still largely unanticipated,” Vitner said. “The energy boom was so big that it carried over into all facets of the economy.”

3. Housing

The U.S. economy is firing again on most cylinders — except housing.

The 5.12 million home sales reported by the National Association of Realtors in November were 3.8 percent below a year earlier, and tight credit makes it difficult for many Americans to get mortgages.

“That’s one of the things that have held back the recovery so far,” said Gus Faucher, senior economist at Pittsburgh-based PNC Financial Services.

Faucher anticipates a gradual increase in the number of single-family home “starts,” signaling an intent to build a new house, in 2015, to about 725,000 for the year, up from the 646,000 starts that had been recorded for 2014 through October (home-building slows sharply in November and December).

“I don’t think we’re going to get a boom in homebuilding,” he said. “But certainly there is room for gradual improvement.”

4. Household formation

One of the aberrations in the recovery is the unusually low rate of household formation. That’s a fancy way of referring to people moving in together, as couples or roommates, and forming new households. After the Great Recession, many young people remained living in their parents’ homes or crowded into apartments together.

“I expect household formation to substantively pick up in 2015 as millennials break away from their parents and strike out on their own,” said Mark Zandi, chief economist for Moody’s Analytics in West Chester, Pa.

An increase in household formations is associated with greater economic activity, especially home sales and apartment rentals. It also implies rising incomes.

“I think that is the single most important development for 2015, that we will finally see acceleration in wage growth. Workers will get real (pay) increases,” Zandi said.

5. Global events

Events in faraway places matter, but they’re unlikely to derail the U.S. recovery. That’s because exports account for only 13 percent of the economy. In fact, slower growth abroad may, in a perverse way, benefit the U.S. economy.

“Yes, it’s a vulnerability, but a limited vulnerability,” said Nariman Behravesh, the chief economist for IHS Global Insight in Cambridge, Mass. “Weakness in the rest of the world can be good news for the U.S. It could lower commodity prices even further, helping to keep inflation and interest rates low.”

While the impact on the U.S. economy is limited, economic deterioration across the globe might be troublesome especially for companies with global operations, such as General Electric, Chrysler or Caterpillar.

“We are worried about growth in Europe, Japan and China,” said Behravesh. “China is a worry. We’re now saying only 6.5 percent growth in China. Could it be lower than that? I think entirely it could.”

AFP Photo/Spencer Platt

Shop our Store

Headlines

Editor's Blog

Corona Virus

Trending

World