Tag: pew
Our Poisonous Partisan Politics

Our Poisonous Partisan Politics

A recent study from the Pew Research Center shows that contempt across the partisan divide is bitter and widespread. Respondents displayed a nasty animosity for the opposing side and showed little sign of tolerance for conflicting views.

Party polarization has been underway for years, and the Congress has never been so divided. But the toxic, finger-pointing rabble has escaped like a demon from Capitol Hill and spread plague-like throughout the United States. The toxicity doesn’t stifle, it chokes. Discourse has become nearly impossible. Wherever one stands, the other side is no longer judged as merely wrong or misguided, but is now considered dangerously stupid and lazy; scary, dishonest, immoral, and more than anything, a threat.

In 2014, a Pew study of political polarization noted the “growing contempt that many Republicans and Democrats have for the opposing party,” and since then, “many” is now “most.”

This year, 58 percent of Republicans have a “very unfavorable impression” of Democrats, 12 percent more than two years ago and 26 percent more than in 2008. Democrats’ disdain for Republicans has followed a similar trajectory.

The 2014 survey asked Democrats and Republicans who offered “very unfavorable opinions” of the opposing party if they felt the other side was “so misguided that they threaten the nation’s well-being.” Thirty-seven percent of Republicans and 31 percent of Democrats felt this way, and in two years those numbers have increased by eight and 10 points, respectively.

Among Democrats, 55 percent say the Republican Party makes them feel “afraid.” Forty-nine percent of Republicans say that about Democrats. These numbers increase among the highly politically engaged, with 70 percent of Democrats and 62 percent of Republicans fearing their opposition.

Disdain for the other side is as strong, and sometimes outweighs, positive feelings about the party one belongs to. Majorities of Democrats and Republicans cite their party’s platform as their deciding factor for joining, but almost as many say they were driven by “the harm caused by the opposing party’s policies.” Even independent voters, who have come to outnumber members of both major parties and tend to lean Democratic or Republican, are overwhelmingly inclined to cite negative factors for their loose partisan ties.

On a “thermometer” scale of 0-100, where zero is the coldest rating and 100 is the warmest, Democrats give Republicans the mean rating of 31, and Republicans give Democrats a 29. Things get even colder for politicians: Democrats’ average rating of Trump is 11, and Republicans, on average, give Clinton a 12.

Among Democrats, the most resonating critique of Republicans is that members of the GOP are more closed-minded than other Americans; 70 percent of Democrats feel this way. Forty-two percent of Democrats say Republicans are more dishonest, 35 percent say they are more immoral, and 33 percent say they are more unintelligent. By contrast, more than half of Republicans, 52 percent, see Democrats as more closed-minded than other Americans and nearly as many say Democrats are more immoral, dishonest, and lazy.

Not surprisingly, respondents expressed approval for members of their own party. Sixty-seven percent of Democrats consider themselves more open-minded than other Americans, and 59 percent and 51 percent of Republicans, respectively, say GOP members are more hardworking and moral. Republicans and Democrats also show a tendency to view the opposing party as highly ideological, while considering their own less ideological.

There is some hope for social cohesion among diverging parties, but little hope for helpful political discussion. The majority of Democrats and Republicans think they could get along with a new neighbor from the other party, but 42 percent of Democrats and 43 percent of Republicans say it would be easier to welcome members of their own party into the neighborhood. Democrats and Republicans are about equally inclined to say political conversation with people whom they disagree with is “stressful and frustrating” as “interesting and informative” — and either way, an equal amount of Democrats and Republicans, 44 percent, say they “almost never” agree with the other party’s positions.

The cause for this divide is unclear, but researchers suggest a merging of politics, lifestyle, and choice of residence has limited many Americans’ exposure to people with different opinions.

Pew President Michael Dimock told NPR, “If we in fact are surrounding ourselves increasingly with like-minded people, that becomes another factor that can potentially create distance between ‘our side’ and ‘their side.’”

In a 2015 article for the Washington Post, titled The top 10 reasons American politics are so broken, social psychologist Jonathan Haidt and political science professor Sam Abrams write, “Liberals and conservatives dress differently, decorate their rooms differently, read different books, take different vacations and drink different alcoholic beverages. As the differences between supporters of the two parties became ever more pervasive and ever more visible to the naked eye, it became easier to spot members of the other team and then dislike them for the way they live.”

There is also the strange relationship between policy positions and political parties that seems to decide voters’ stances on how to handle seemingly disconnected issues.

“The more conservative you are on foreign policy, the more likely you are to be conservative on social issues, on economic issues, on the role of government,” Dimock said. “These dimensions, many of which had very little correlation with each other in the past, are getting increasingly aligned.”

Haidt and Abrams say this is the result of a combination of geography, immigration, and what they call ideological purification, meaning a lack of intellectual diversity within both major parties. The Republicans are conservatives and the Democrats are liberals, which was not the case before 1980.

“The Democratic Party was historically an agrarian party with its power base in the South,” Haidt and Abrams write. “But with the political purification of the parties, the Democrats have become the urban party, focused on issues of concern to city dwellers and expressing more cosmopolitan and secular values. Rural areas, meanwhile, shifted toward the Republican Party. The GOP became much more hospitable to rural interests and values, which tend to be more religious, patriotic and family-oriented.”

So why is there so much hostility on the political landscape? As Haidt and Abrams note, “a basic principle in social psychology is that people will divide themselves up quite readily based on the most trivial distinctions” – and these are not trivial matters.

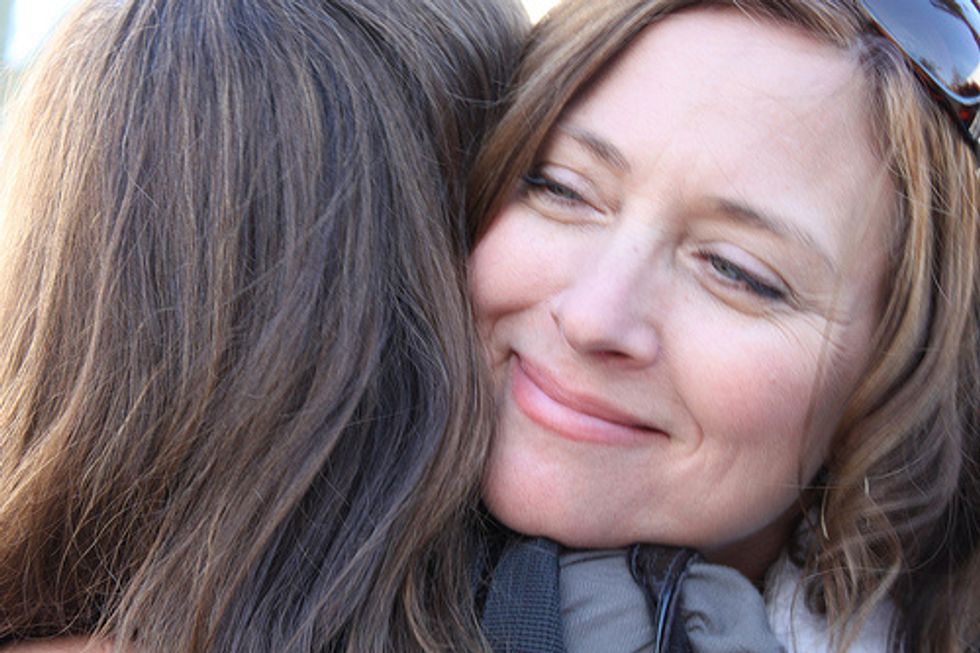
Photo: Protesters confront a woman, center, leaving a rally for Republican U.S. presidential candidate Donald Trump in Fresno, California, U.S. May 27, 2016.  REUTERS/Noah Berger

Wealth Gap In America Widens To Record Level, Report Says

Wealth Gap In America Widens To Record Level, Report Says

By Don Lee, Tribune Washington Bureau (TNS)

WASHINGTON — The wealth gap between middle- and upper-income households has widened to the highest level on record, says a new report.

Using the latest Federal Reserve data, the Pew Research Center said Wednesday that the median wealth for high-income families was $639,400 last year — up 7 percent from three years earlier on an inflation-adjusted basis.

For middle-income families, the median wealth — that is, assets minus debts — stood at $96,500 last year, unchanged from 2010.

The result is that the typical wealth of the nation’s upper-income households last year was nearly seven times that of middle-class ones. By Pew’s calculations, that is the biggest gap in the 30 years that the Fed has been collecting statistics from its Survey of Consumer Finances.

“The latest data reinforces the larger story of America’s middle-class household wealth stagnation over the past three decades,” Pew said. “The Great Recession destroyed a significant amount of middle-income and lower-income families’ wealth, and the economic ‘recovery’ has yet to be felt for them.”

In Pew’s definition, middle-income households are those earning between two-thirds and twice the median income, after adjusting for household size. The median marks the halfway point.

For example, a one-person household was categorized as middle income if its earnings last year were at least $22,000 but less than $66,000. For a four-person family to qualify as middle income, earnings would have to be at least $44,000 but less than $132,000.

Based on these thresholds, 46 percent of American households were classified as middle income last year. One-third were considered lower income, and 21 percent upper income.

Incomes represent wages and other earnings such as interest and profits, whereas wealth is the value of stocks and other assets such as homes and cars, minus debts.

The Pew data shows that lower-, middle- and upper-income households all have yet to recover the wealth lost in the Great Recession. But higher-earning families had the smallest percentage loss of wealth from 2007 to 2010. And these same households, thanks in good part to their disproportionately large stock holdings, recovered a substantial part of the lost wealth since then, while lower-income families made no pickup at all.

Seen over a longer period, the typical wealth of upper-income households in 2013 was about double what it was in 1983, after adjusting for inflation.

For middle-income households, there was practically no change in wealth over the 30-year period. The median wealth for the middle class was $94,300 in 1983. That peaked at $158,400 in 2007 and has since retreated to $96,500.

For lower-income households, wealth rose to a high of $19,100 in 2001, but has since fallen to $9,300 last year. Their median wealth was $11,400 in 1983.

Photo: 401(K) 2012 via Flickr

With Majority Secure, Republicans Have No Interest In Compromising

With Majority Secure, Republicans Have No Interest In Compromising

In the wake of the Republican Party’s near-sweep of the midterm elections, the Beltway media and politicians from both sides of the aisle profess to agree on one thing: Democrats and Republicans must set aside their partisan squabbles and finally get back to the hard work of governing.

“When the American people choose divided government, I don’t think it means they don’t want us to do anything,” soon-to-be Senate Majority Leader Mitch McConnell (R-KY) proclaimed after the election. “We ought to start with the view that maybe there are some things we can agree on to make progress for the country.”

Just as long as nobody tells his Republican base.

A new Pew Research Center survey, released Wednesday, finds that Republicans are dead set against seeing their representatives in Congress compromising with President Obama. Overall, Americans agree 57 to 40 percent that Republican leaders “should try as best they can to work with Barack Obama to accomplish things, even if it means disappointing some groups of Republican supporters.” But Republicans and Republican-leaning independents view things very differently; just 32 percent want to see GOP leaders work with the president, while 66 percent would prefer seeing them “‘stand up’ to Obama on issues that are important to Republican supporters, even if it means less gets done in Washington.”

Those numbers are the inverse of Democratic attitudes towards compromise, and represent Republicans’ most obstinate stance in any of Pew’s last three post-election surveys.

Pew Chart

Similarly, Republicans and Republican-leaning independents agree by a 57 to 39 percent margin that their party’s leadership should move in a more conservative direction, rather than moderating. By contrast, Democrats would prefer to see their party moderate its policies.

Pew Chart 2

In other words, Republican voters strongly believe that they have provided a mandate for Congress to bring conservative change to Washington. There’s just one problem: The rest of the nation disagrees. Just 44 percent of the public approves of Republican leaders’ policies and plans for the future, while 43 percent disapprove. Similarly, while 41 percent want Republican leaders to take the lead in solving the nation’s problems, 40 percent would prefer that President Obama sets the agenda.

If all of this strikes you as a recipe for more gridlock, then you are in good company. Just 18 percent told Pew that relations between Republicans and Democrats will get better in the coming year, and less than 50 percent believe that either President Obama or Republican leaders will successfully enact their agendas.

Photo: Gage Skidmore via Flickr.com

Want more political news and analysis? Sign up for our daily email newsletter!

Number Of Stay-At-Home Mothers On The Rise, Study Says

Number Of Stay-At-Home Mothers On The Rise, Study Says

By Walter Hamilton, Los Angeles Times

LOS ANGELES — The percentage of mothers who stay home with their children is rising due to shifting demographics and a troubled job market.

The portion of stay-at-home mothers with children under age 18 rose to 29 percent in 2012 from 23 percent in 1999, according to a new Pew Research Center analysis of government data. Prior to that, the share of stay-at-home moms had declined for three decades as women in general flooded into the workforce.

The increase in home-based mothers is driven partly by the desire to focus on children. But it’s also partially a result of economic hardship for those lower on the financial rungs.

One-third of stay-at-home mothers live in poverty, compared with 12 percent for their counterparts who work outside the home. Stay-at-home mothers also are more likely than working moms to be immigrants and less likely to be white, according to the report.

“For a variety of reasons — from a tough job market to changing demographics — we’re seeing an uptick in the share of mothers who are staying at home,” said D’Vera Cohn, one of the report’s authors.

“Stay-at-home mothers are a diverse group,” Cohn said. “They are younger and less educated than their working counterparts, and more likely to be living in poverty. Many are staying at home to care for family, but some are home because they can’t find jobs, are enrolled in school or are ill or disabled.”

The financial status of stay-at-home mothers depends partly on marital status.

Married stay-at-home moms are generally better educated and less likely to live in poverty, according to Pew. The vast majority of married stay-at-home mothers — 85 percent — say they stay home to care for their families, though a rising portion — 6 percent — complain that they can’t find a job.

Single or co-habitating mothers, by contrast, are likelier to be at home because they are unemployed, disabled or enrolled in school.

Currently, 28 percent of American children are being raised by a stay-at-home mother. That’s up from 24 percent in 2000 but down from 48 percent in 1970, according to Pew.

Lisa Sjolund via Flickr.com