The data nerds among us were happy to finally get their September jobs report fix, even though these data are somewhat stale now. However, we still learned a few things about the state of the economy.
Before saying what we learned, it’s worth a few words on what we didn’t learn but people are saying anyway. First and foremost, this was not a strong report in any real-world sense of the term.
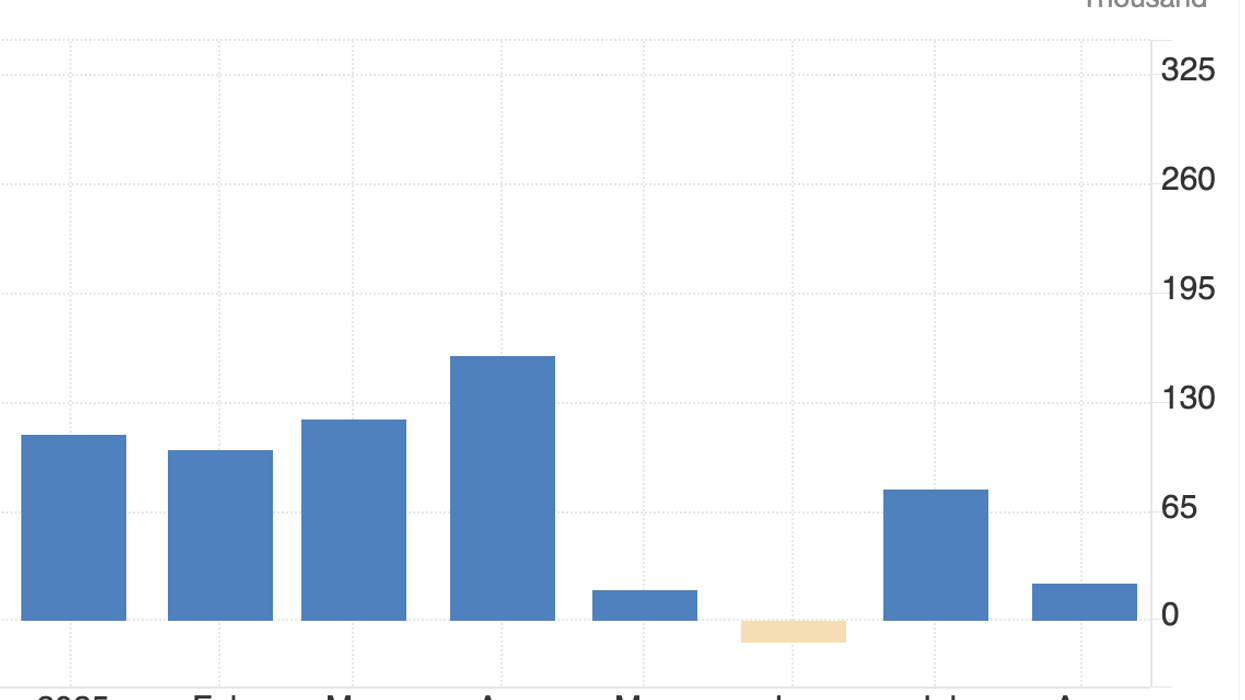
To be clear, the 119,000 jobs reported for the month was stronger than most analysts had expected, including me. But this hardly implies robust job growth. We averaged 170,000 jobs a month in 2024, so now we’re supposed to be celebrating a report showing job growth that is 70 percent of last year’s average?
But it gets worse. The prior two months’ data were both revised down. The average growth for the four months ending in September was less than 40,000. Furthermore, almost all the growth was in healthcare. Since May, the economy has added 174,000 jobs. The healthcare sector added 157,000 jobs, accounting for more than 90 percent of job growth over this period.
The job growth number for September is also likely to be revised downward. The direction of revisions tends to be autocorrelated. If the prior month was revised downward, then it’s better than a 50 percent chance this month’s number will be revised downward. When we get revisions for September in a few weeks, we will likely be looking at a lower number than 119,000.
Sectors that Are Not Growing
While healthcare continues to add jobs at healthy pace, although down from its 56,000 monthly average in 2024, most other sectors are not. Notably, manufacturing, which has been a main focus of the Trump administration, is shedding jobs. It lost 6,000 jobs in September; employment is down 49,000 since January.
Mining is also shedding jobs. The sector lost 2,000 jobs in September, pushing employment 8,000 below its January level. One of the many things that Trump seems to not understand is that if oil prices are low, oil companies don’t want to drill baby drill. With the current price hovering near $60 a barrel, drilling is unprofitable in many areas.
Construction employment was at least moving in the right direction, adding 19,000 jobs. But this just took employment back to its May level. Since January, the sector has created 19,000 jobs, an average of 2,400 a month. That compares to an average of 16,000 a month in 2024.
Sectors Not Growing by Design
Trump made his desire to cut federal government employment explicit and set Elon Musk to the task on his first day. The sector lost 2,700 jobs in September and is down 85,100 (3.6 percent) since Trump took office. Many of the workers taking Musk’s deferred departure were still on payroll through September. This should mean there will be a sharp fall in the October data.
Employment growth in state and local governments has also slowed considerably. Budget cuts at the federal level are playing a big role in stressing state and local governments. They have created 91,000 jobs since January, an average of 11,400 a month. That is down from a rate of almost 34,000 a month in 2024.
The category, “scientific research and development services” has lost almost 20k jobs this year (2.0 percent). It had been growing modestly, adding 6,400 jobs in 2024.
One final point on job growth, as has been widely noted, the clamping down on immigration means the labor force is growing far more slowly. We likely need only 30,000-60,000 jobs a month to keep the unemployment rate stable.
Employment of Native-Born Workers Is Not Surging
One of the incredibly foolish things Republicans are saying is that the September employment report shows employment of native-born workers is soaring. Just looking at the published numbers, employment of native-born workers is up by 2,500,000 over the last year and by 680,000 in September alone.
The problem with this story is that it misunderstands how the Bureau of Labor Statistics constructs its employment survey. The survey has population controls, which impute a certain population every month based on the data from the prior year and estimates of growth due to birthrates, death rates, and immigration. The controls are locked in regardless of what actually happens in the world.
The controls fix the size of the population, but the number of people reported as foreign-born is taken from the survey. This number has fallen sharply. Part of that is due to people being deported or choosing to leave. Part of the drop is due to people not answering the survey and part of it is due to people lying and identifying as native-born, which is understandable under the circumstances.
Given the construction of the data, a drop in the number of foreign-born workers automatically leads to an increase in the reported number of native-born workers, since the total is fixed by the population controls. This means if Steven Miller took speed, stayed up all week, and deported every last foreign-born worker, the data would show an increase in native-born employment of 32,000,000. (I go into this in a bit more detail here.)
Anyhow, we surely have lost some number of foreign-born workers as a result of the Trump administration’s deportation drive. At this point, we don’t have any good basis for knowing the change in native-born employment, although the employment-to-population ratio is a good start. At 59.0 percent, it is 0.3 percentage points less than it was in September of 2024.
Unemployment is Edging Higher and Labor Market Is Weakening
As many of us had suspected, we are seeing a gradual weakening, not a collapse, of the labor market. By historical standards, 4.4 percent is relatively low, but we are a full percentage point above the recovery low in April of 2023.
For disadvantaged groups the increase has been considerably larger. The unemployment rate for Black workers stood at 7.5 percent in the September report, while the unemployment rate for young workers (ages 20-24) was 9.2 percent.
Both figures are the same as in the August data, but the unemployment rates for these groups are highly erratic. This means that the sharp deterioration in the labor market situation reported for these disadvantaged groups reported in prior months was not an aberration. The unemployment rate for Black workers had been at 4.8 percent in April of 2023 and the unemployment rate for young workers bottomed out at 5.5 percent in the same month. It is not surprising that these disadvantaged groups would rise much more than for the workforce as a whole in a weakening labor market.
We Are in a Low Quit, Low Hire Economy
Many analysts have long noted the sharp falloff in job movers reported in the JOLTS and other data. This report strengthens that view. The share of unemployment due to voluntary quits rose slightly to 11.8 percent, but that is still down from an average of 13.2 percent in 2018-2019, when the unemployment rate was comparable. Even more discouraging, the share of unemployment due to permanent layoffs rose 0.8 pp to 35.8 percent, the highest level since December 2021. That compares to an average of 33.3 in 2018-2019.
One piece of data that argues against much deterioration in the labor market is the relatively modest rise in the number of new and continuing unemployment insurance (UI) claims. Guy Berger regularly cites this statistic in his excellent Substack, High Frequency Labor Market Indicators.
While the weekly data on claims are useful, Guy also includes an index of weekly Google searches for “file for unemployment insurance.” This index had tracked the weekly claims data closely until early 2025 when the search measure rose rapidly, but the claims data remained pretty much flat.
There is not an obvious explanation for this divergence but let me throw one out. Even though most undocumented workers would not be eligible for UI, there are many people with some type of temporary status, who could end up unemployed. There are also people who might be here legally but have family members whose status is ambiguous. People in these situations may not want to risk calling attention to themselves by filing for unemployment insurance.
If there was a falloff in the willingness of foreign-born workers to file for UI, it could offset an increase in the number of people facing unemployment. A bit less than 20 percent of the workforce is foreign-born, so a substantial falloff in the probability of laid-off foreign-born workers applying for benefits would conceal a rise in layoffs. This story is obviously speculative, but the sudden divergence of searches and applications does indicate something different is happening in 2025.
A Rise in Wage Growth?
There was some good news in the September report. Wage growth picked up by my preferred measure. This takes the average hourly wage for the last three months (July-Sept) compared to the average for prior three months (April-June). That rose to a 4.0 percent annual rate. This is roughly the same as its rate in 2023 and 2024. It had shown some signs of slowing in prior months. The rate of wage growth for non-supervisory workers in the low-paid restaurant sector also picked up to 3.9 percent; it had been under 3.0 percent.
I said this is my preferred measure, but it is not widely used. If we take the year-over-year rate of wage growth, there has been little change. It stood at 3.7 percent in September, the same as the August rate.
I am not thrilled with using the year-over-year rate since it includes data that at this point is quite old. If wages grew rapidly at the end of 2024, we would show a high pace of wage growth even if the rate had slowed substantially over the last few months.
Taking a single month, whether it be for a one-month period or even a three or six-month period, suffers from the fact that the monthly data are highly erratic and subject to large revisions. For example, the average hourly wage for August was originally reported as $36.53. It was revised up this month to $36.58.
This gives a hugely different story on the pace of wage growth using August as an endpoint. Annualizing the three-month rate for the originally reported number of $36.53 gives a 3.4 percent rate of wage growth. Annualizing using the revised $36.58 number gives a rate of wage growth of 3.9 percent. These are very different pictures of the labor market.
Taking an average of three months reduces, but does not eliminate, this problem. We’ll have to see whether the measure I prefer ends up being a useful predictor of future wage growth in this case. But for September, it does show a better picture than the data had indicated in prior months. Wage growth had been falling towards the inflation rate, meaning that real wage growth was stalling. The September data imply that wages are still outpacing inflation by close to a percentage point.
What About More Recent Data?
The September jobs report is giving us historical information at this point. The household survey that gives us the unemployment rate was taken more than two months ago. The more recent data seem to support the story of further labor market weakening.
The data from the payroll company ADP, now released weekly, show the private sector losing a modest number of jobs in October. With all delayed layoffs in the federal government from DOGE ending in September, there will be some additional job loss in the public sector as these workers will no longer be on the payroll.
The Indeed data for job listings continued its downward path, although there was a modest uptick in the mid-November figure. Continuing unemployment insurance claims also show a modest uptick, which is consistent with some further deterioration in the labor market.
We will not get unemployment data for October. The survey was not conducted and asking people to look back will not give reliable data. (This may sound stupid, but it really does matter exactly how and when the questions are asked.)
My expectation is that there will be a further rise in the unemployment rate for November when we get the data in the middle of next month. (This one is delayed a couple of weeks because of the shutdown.) I will be looking closely at the wage data. I will be surprised if there really is an uptick in the pace of wage growth.
The weakening of the labor market is bad news for tens of millions of workers who are trapped in their jobs and seeing lower real wages due to inflation. But it is not full-fledged recession stuff. That will have to wait for the collapse of the tech bubble.
Dean Baker is a senior economist at the Center for Economic and Policy Research and the author of the 2016 book Rigged: How Globalization and the Rules of the Modern Economy Were Structured to Make the Rich Richer. Please consider subscribing to his Substack.
Reprinted with permission from Dean Baker.