Going a month without government data makes it difficult to understand what is going on with the economy. We still have some data from private sources trickling in, and we have some state data, notable unemployment insurance claims, but without the federal data on items like unemployment, job turnover, and Gross Domestic Product it is much harder to make much sense of what is going on in the economy.
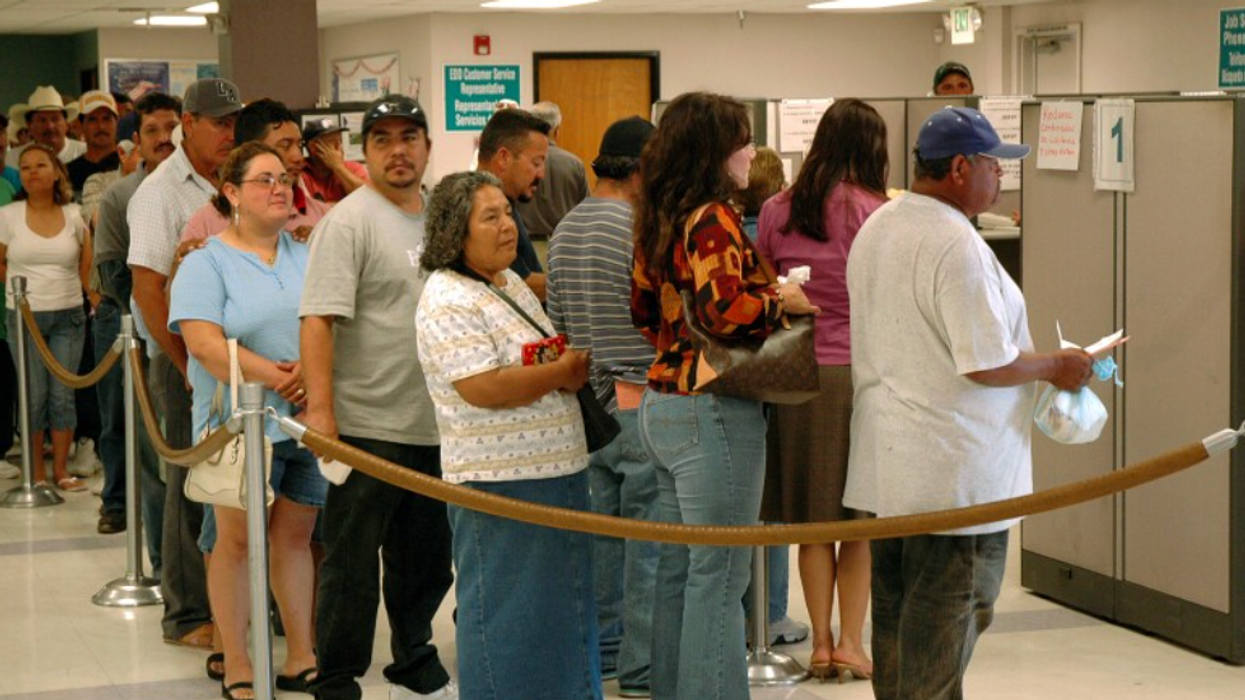
In assessing the economy, the state of the labor market should always be front and center. Most people get most of their income from working, so the labor market matters in a really big way. Also, since people spend much of their waking life at work, their working conditions matter a great deal. This means it matters a lot whether people feel they can quit a job they don’t like and easily find another. In addition, the option to work from home matters to tens of millions of workers.
The best place to start in viewing the labor market is Guy Berger’s weekly Substack, High Frequency Labor Market Indicators. Guy covers most of the available data, and like the rest of us, he is seeking out alternative sources during the shutdown.
In his most recent assessment, I’ll start with where I strongly agree with him. It is easy to exaggerate the importance of big layoff announcements at tech giants like Meta and Amazon.
As Guy points out, in a normal month, roughly 1.7 million workers lose their job. The 30,000 layoffs announced at Amazon or the 10,000 at Meta are just a tiny fraction of this number. If they are representative of what is happening at companies across the country, this is a big deal, but by themselves, they are not. We also have seen this story before. In 2022, there were announcements of big layoffs at the tech companies, even as the economy was adding jobs at a very rapid pace.
Where I differ with Guy is his more generally sanguine view of the state of the labor market. Guy points to the weekly data on unemployment insurance, where both initial and continuing claims show no major upticks. This is important evidence that there has been no big uptick in layoffs.
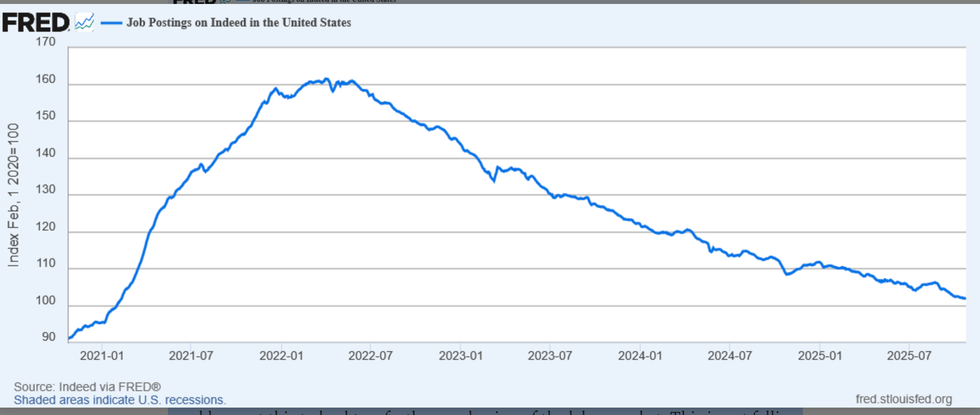
But I am more concerned about the other side of the story. It looks like hiring has fallen off. My main piece of evidence here is the Indeed hiring index. Guy also points to this index but says that we are just on the same downward slope we’ve been seeing for the last three and a half years.

This is true, but this is a case where we have to think about levels rather than changes. The most recent level reported for the week ending October 24 was 101.9. This is 5.5 percent lower than the 107.8 reading for the week ending April 19, six months ago. That was already a point where the labor market was notably weaker by most measures than in 2024. If we are seeing a modest rise in layoffs, and a five percent drop in hires, we would expect this to lead to a further weakening of the labor market. This is not falling off a cliff, but a gradual deterioration.
There is the complication that labor force growth has fallen through the floor, now that immigration has been largely halted. But again, it is important to remember that the net additions to the labor market each month are swamped by flows. The falloff in new entrants due to the cutoff of immigration is perhaps 100,000 a month, the number of new hires is over five million a month.
Supporting this deterioration view is the Conference Board’s Index measuring the number of people saying jobs are plentiful, minus those saying jobs are hard to get. This index has been on a steady decline since peaking in early 2022. The current level is roughly where we were at the start of 2017 when the unemployment rate was over 4.5 percent. That is not a disaster, but it is a deterioration from where we have been and notably worse than 2018-19, two strong years for the labor market prior to the pandemic.
This downturn also seems to be affecting wage growth. The Indeed measure for wage growth in advertised jobs is down to 2.5 percent, 0.8 percentage points below its year ago level. This is also close to a percentage point below its 2019 level. With inflation ticking up modestly due to tariffs and other factors, this slowing in nominal wage growth (also shown in recent data from the establishment survey) likely means that real wage growth has fallen close to zero.
To be clear, none of this suggests a disastrous picture. We are not looking at recession levels of unemployment, but to me it looks like the labor market is notably weaker than 2024 or 2018-2019. Workers no longer feel they have their choice of jobs, and real wages are barely rising for most workers, and for many they are falling. And workers in disadvantaged groups, like Black and young workers, are seeing considerably worse labor market conditions.
Is Avian Flu Making a Comeback?
There are accounts from around the country of avian flu hitting both wild bird populations and also poultry stocks on farms. Last year avian flu sent egg prices soaring. Wholesale prices have already risen sharply from lows hit in October but are nowhere near the peaks we saw last March. I have no great insights to offer here but given the politics of egg prices around the election last year, it would be worth keeping an eye on this one.
The Circular Flows of the AI Bubble
There has been considerable reporting on how the AI bubble at this point might be driven in part by circular payments, with producers giving money to customers to buy their products. For example, Nvidia is investing $100 billion in OpenAI, which is a major customer for its chips.
If the potential problem here is not clear, imagine Oscar Meyer invested $1 billion in both Jack and Jill’s premium hot dog stand. Jack and Jill then made huge purchases of Oscar Meyer hotdogs, which they then sold at a massive loss. Jack and Jill could keep doing this because Oscar Meyer kept investing more money in their hotdog stands.
On Oscar Meyer’s books all looks great because their hotdog sales, and profits, are soaring. The money invested in the hotdog stands does not count as a loss. It is an investment, which they can keep on the books as long as market conditions don’t force them to write it down. If Jack and Jill’s hot dog stands are privately traded, that could be a very long time.
I don’t know if this describes the current situation in AI, but it is a serious possibility. At the end of the day, someone may get stuck with some really bad meat.
Dean Baker is a senior economist at the Center for Economic and Policy Research and the author of the 2016 book Rigged: How Globalization and the Rules of the Modern Economy Were Structured to Make the Rich Richer. Please consider subscribing to his Substack.
Reprinted with permission from Dean Baker.

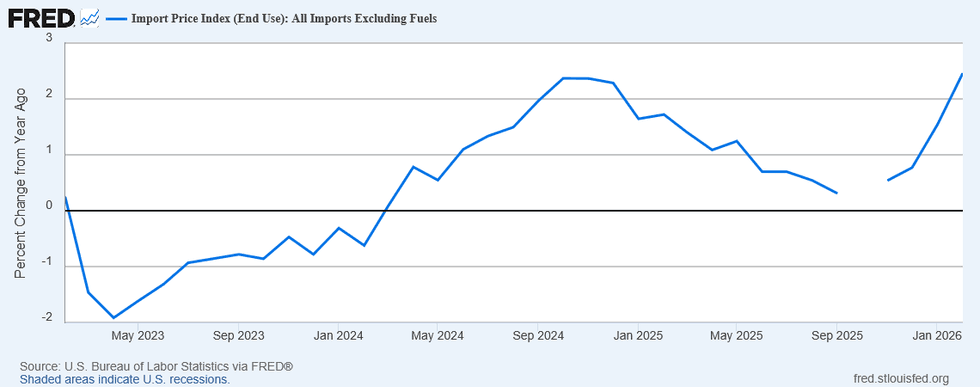 Prices of all imports excluding fuels since April 2023Source: US Bureau of Labor Statistics via FRED