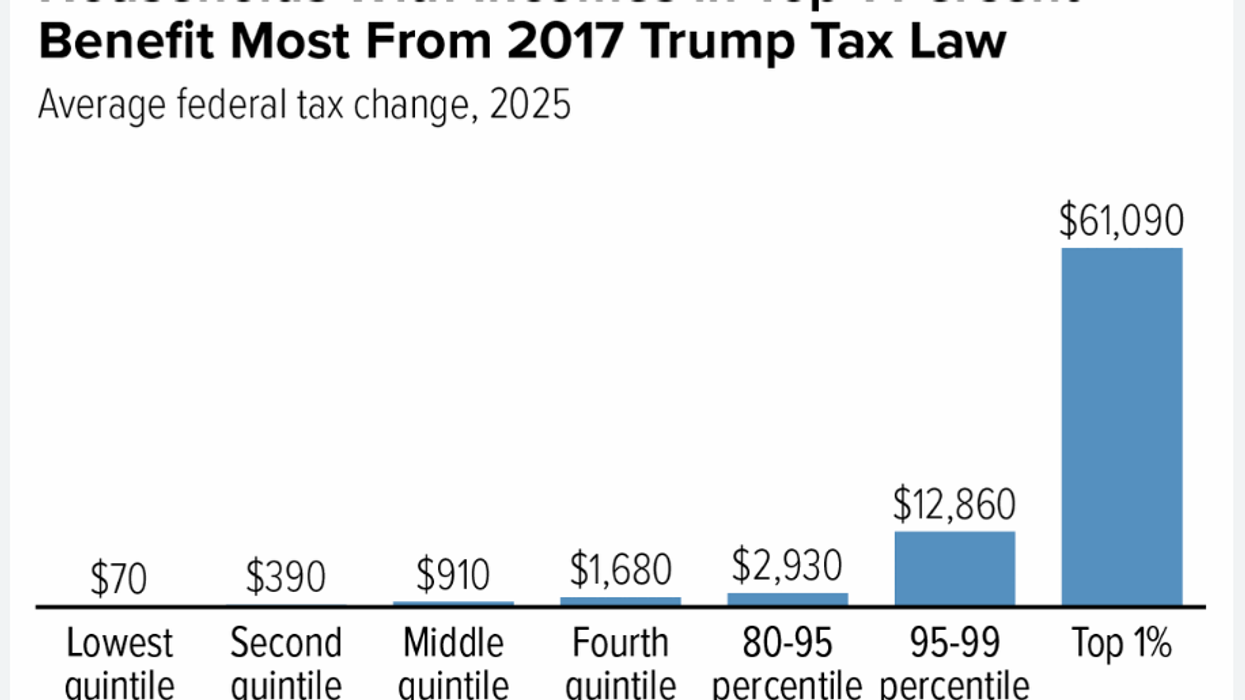
Inflation Irritation: Are Voters Still Enraged Because Trump Lied About Prices?
According to Donald Trump, the U.S. economy is doing great. We’re enjoying a huge boom, there’s no inflation, and we’re all getting tax cuts. We have prosperity like nobody has ever seen before.
But it’s probably not news to you that reality doesn’t agree. Inflation was stubbornly elevated even before the Iran debacle, while growth has been sluggish. Jobs for entry-level workers are hard to find while mortgage and car loan rates are up. Gas-pump prices are above $4 on average and around 10 million Americans are projected to lose health insurance by 2028. Yet the one economic variable that stands out, that really is like nothing anyone has ever seen before,is consumer confidence: The long-running University of Michigan index of consumer sentiment just hit its lowest point ever recorded.
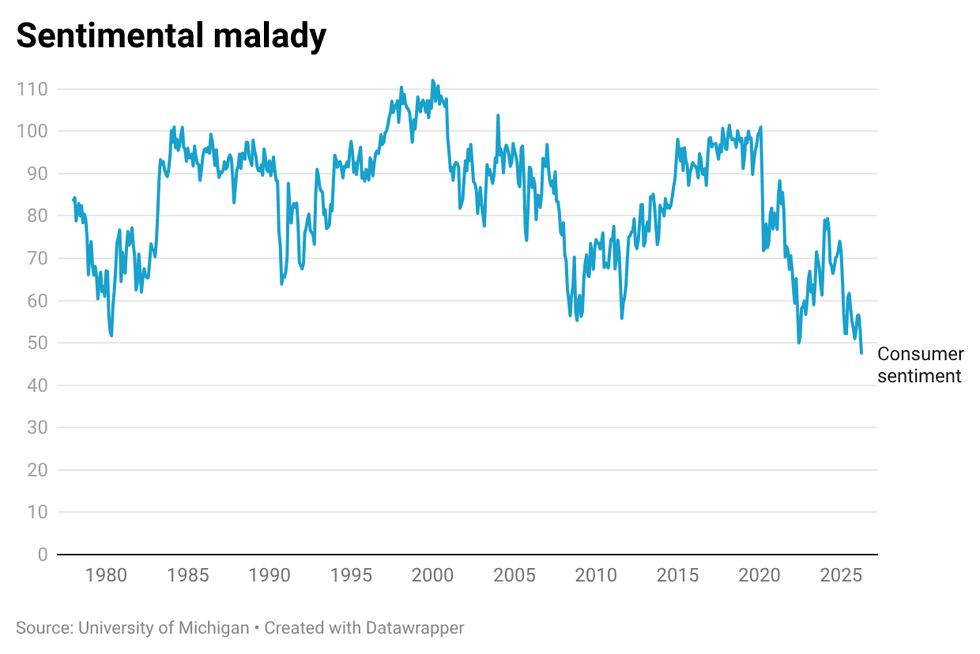
And that’s a puzzle. Obviously, I’m no defender either of Trump’s policies or of his lies. But while the U.S. economy isn’t nearly as good as he claims, it’s objectively not bad enough to justify the worst consumer sentiment in history — worse than during the stagflation at the end of the 1970s, worse than in the aftermath of the 2008 financial crisis.
Warning: Today’s post is wonkier than usual, at least in tone. It basically ends with a question mark. My main goal today is to share a puzzle with readers and explain why I’m not satisfied with the answers smart people — especially two of my favorite data analysis gurus, Jared Bernstein and G. Elliott Morris — are offering. They argue that it’s all about the level of prices. While that is certainly an important factor, I believe that there is more to the story. I believe that the current extremely negative sentiment is a result of Americans’ correct sense that they have been lied to. To discuss this fully will take a couple of posts. So today I will introduce the puzzle and enlarge on the range of explanations in the next post.
Start with the puzzle: Why are Americans so down on an economy that, while not the greatest, isn’t terrible by the usual measures? This isn’t a new question: Kyla Scanlon coined the term “vibecession” in 2022 for a situation in which people feel bad about an economy that doesn’t look that bad by the numbers. But the puzzle has intensified over time, both because the bad feelings have gotten worse and because the vibecession has been so persistent.
Historically, consumer sentiment tracked objective measures of the state of the economy. In fact, you could predict sentiment fairly well using just one variable: the so-called “misery index,” the sum of inflation and the unemployment rate. Here, using annual averages (and the first three months of 2026) is what the relationship between the misery index and consumer sentiment has looked like since 1990:
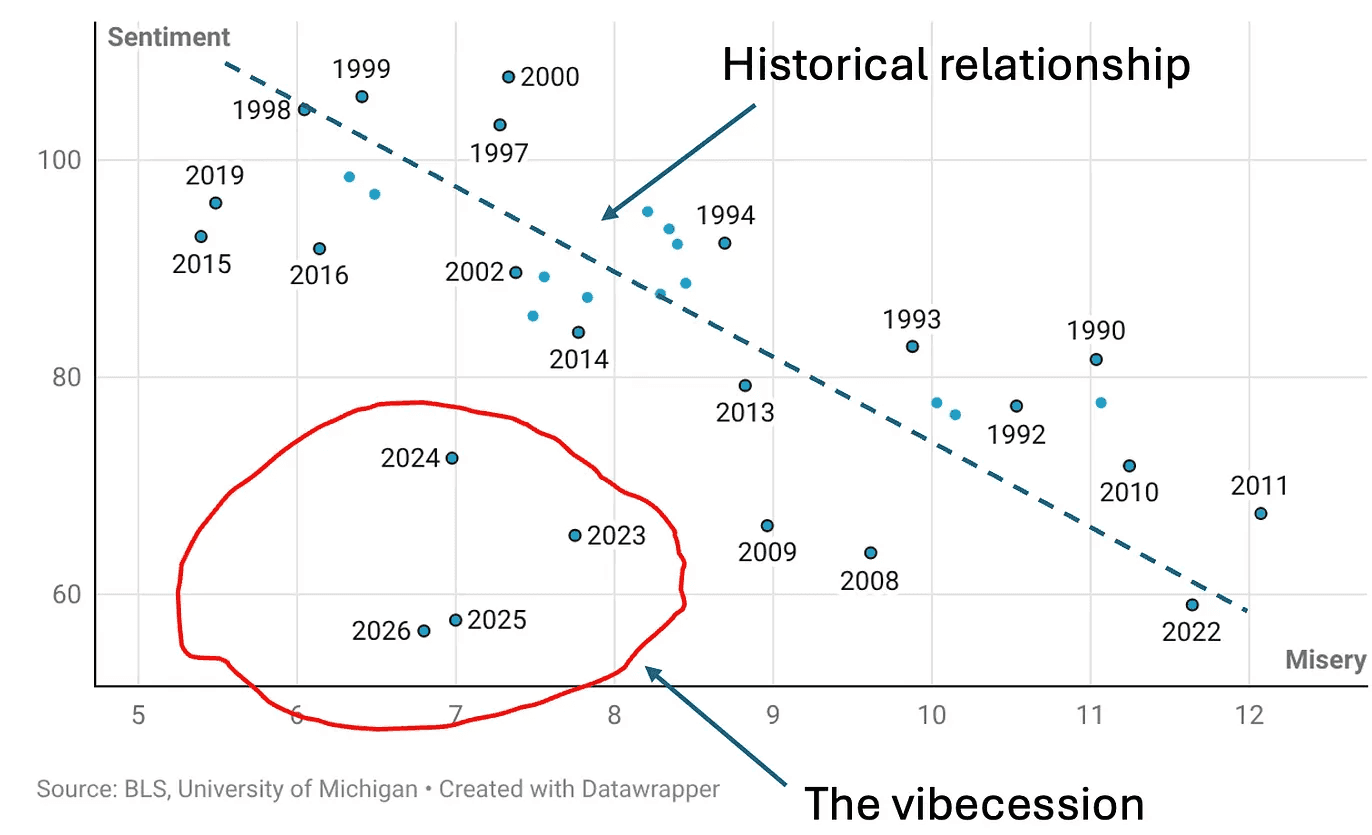
You can get an even better fit to pre-Covid consumer sentiment by adding other economic variables, such as the performance of the stock market. But any way you cut it, since 2022 Americans have felt much worse about the economy than conventional economic measures say they “should.” Moreover, that pessimism has gotten worse over time: consumer sentiment is much worse now than it was in 2023 and 2024.
Many observers have attempted to explain these unusually bad feelings by claiming that the economy is worse than it looks, especially for working-class families. Going through those arguments would take me too far afield right now. But let me just say that some of those arguments, like claiming that ordinary workers didn’t share in the post-Covid recovery, are just wrong. Others, like pointing to much higher interest rates on mortgages and other loans, have validity. But they aren’t sufficient to explain why consumer sentiment is now worse than it was under stagflation and mass unemployment.
So what does explain the current dismal consumer sentiment? Both Bernstein and Morris argue that it’s about the price level as opposed to the rate of inflation.
The chart below illustrates what they mean. It shows the log of the Consumer Price Index since 2014. I use the log because this means that a given vertical distance always corresponds to the same percentage change, and the slope of the line shows the rate of inflation:
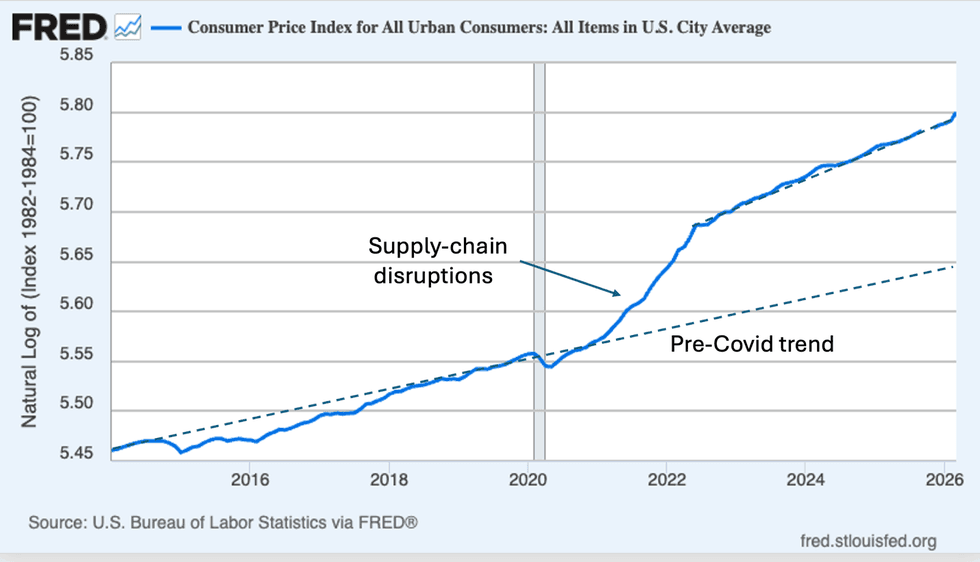
The U.S. experienced a bout of high inflation in 2021-22, largely because of disruptions to supply chains in the aftermath of Covid, plus fallout from Russia’s invasion of Ukraine. This inflation spurt ended as supply chains became unsnarled and oil prices stabilized, and inflation since 2023 has been only modestly higher than it was pre-Covid. However, prices have never come back down and have remained persistently higher than the pre-2020 trend would have predicted.
And the story is that consumers aren’t fully mollified by the fact that inflation — the rate at which prices are rising — has slowed. They’re angry and upset that the level of prices remains much higher than they expected.
Both Bernstein and Morris find that if one adds a price-level variable to an equation predicting consumer sentiment, it tracks the data well. Morris concludes,
When it comes to how Americans feel about the economy today, whether you are measuring using objective structural price data or the polls, it’s the prices, stupid.
Why am I not fully convinced by this explanation? I have three questions:
First, does correlation imply causation? Consumer sentiment fell off a cliff after 2020. Also, prices surged after 2020. But lots of things changed with Covid. How sure are we that the second observation explains the first? Morris points to other survey data that support the prices to confidence link, but we’re still talking about basically one observation, which is always problematic.
Or to use a bit of jargon, is including the jump in prices in your equation just introducing a dummy variable? That is, is it simply a marker that something changed, but not a clear indication of what?
Second, shouldn’t this story have a sell-by date? The big price surge began five years ago. That’s a long time. Do you remember what groceries cost in April 2021? I don’t, not really. At some point one would expect people to recalibrate their expectations of what things “should” cost. Yet the vibecession is if anything deepening with the passage of time.
Third, what about Morning in America? Joe Biden presided over rapidly falling inflation for the second half of his term, yet received no credit because, we’re told, people were upset that prices hadn’t actually come down. But you know who else presided over falling inflation but a still-rising price level? Ronald Reagan. Here’s what happened to the overall level of consumer prices during Reagan’s first term and the Biden presidency:
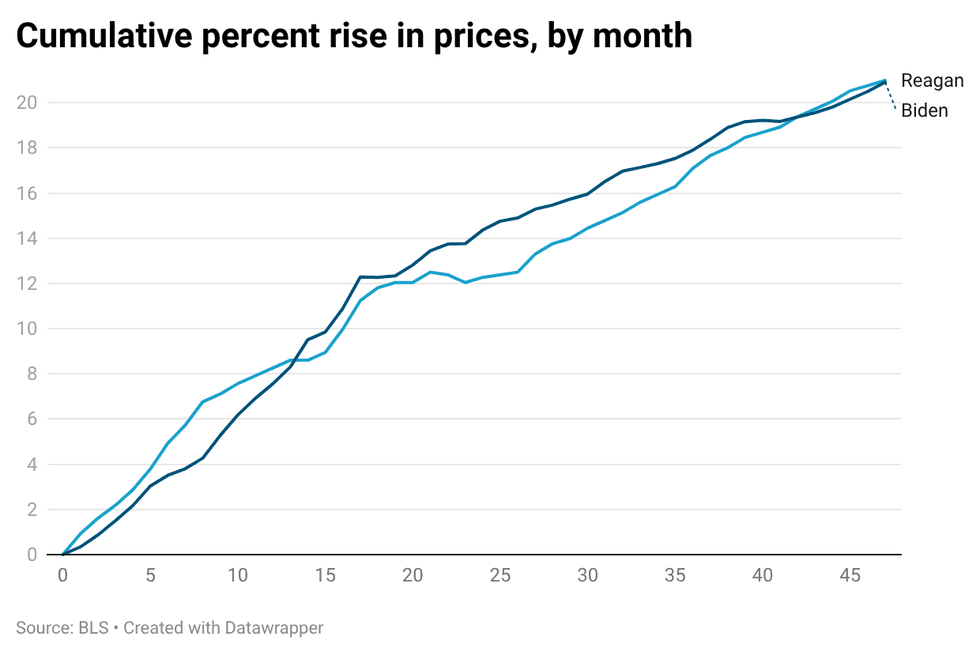
The two presidents’ track records on prices were almost identical. Yet Reagan ran a triumphant reelection campaign on the theme that it was Morning in America, while the Biden economy was vilified. What was that about?
Jared is too good an economist to be unaware of this puzzle. He has shared with me a draft of a forthcoming paper with Daniel Posthumus, in which they do indeed find that the level of prices historically didn’t matter the way it seems to now. They suggest that the long era of relatively low inflation since the mid-1980s may have made people more sensitive to price shocks:
Our findings suggest that a huge storm after a long calm can be more upsetting to people who are not used to bad weather.
Indeed. But why has consumer sentiment gotten so much worse over the past year, even as the low prices people remember recede further into the past?
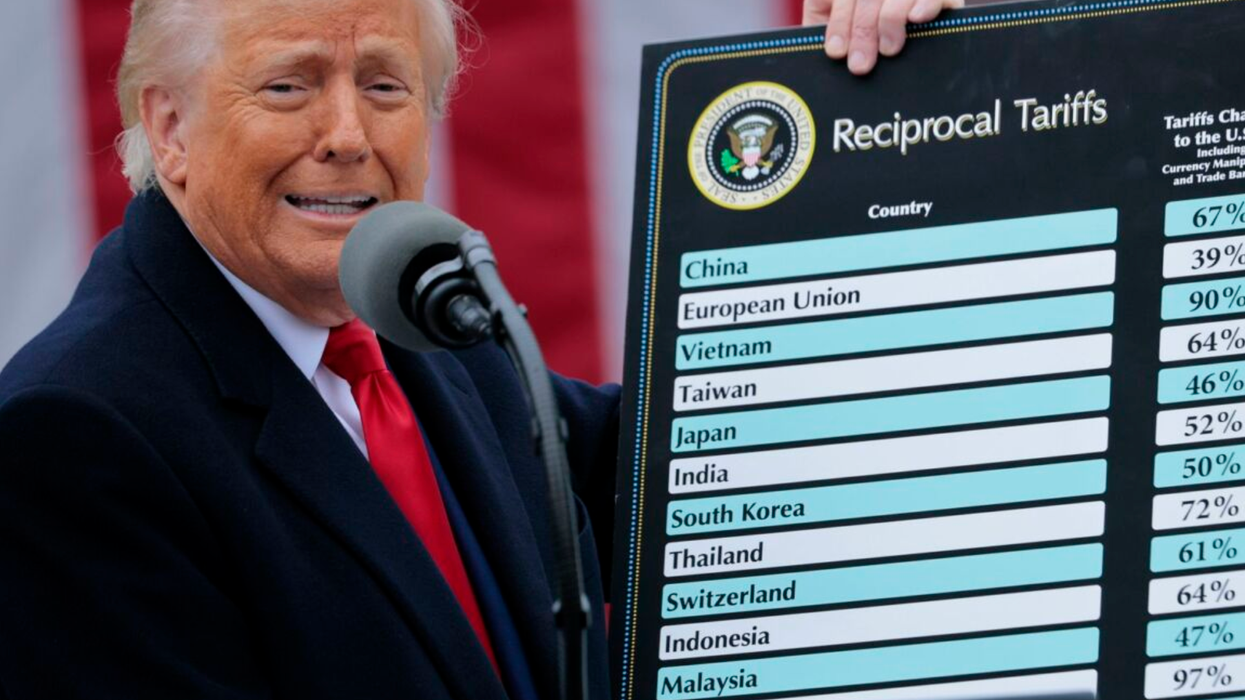
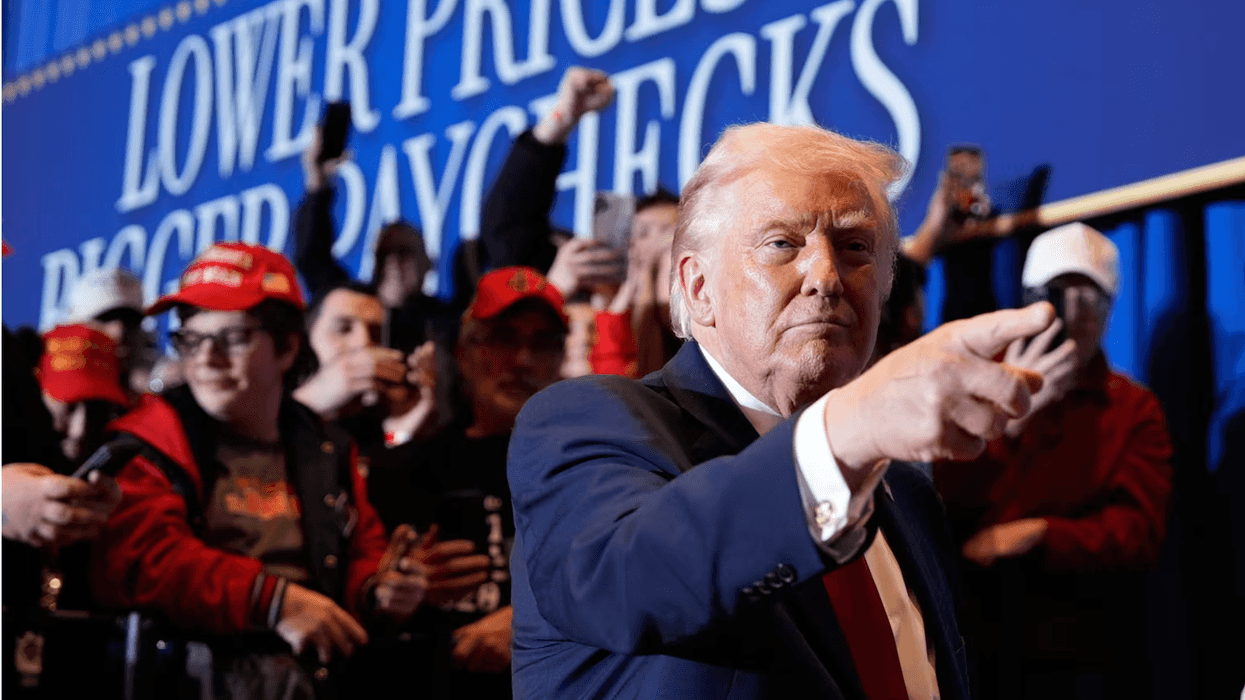
My speculative answer is that it has a lot to do with the lies of 2024. Remember, millions voted for Trump because he promised to reduce grocery prices “on Day One” and promised to cut energy bills in half. Now they know that they were had.
Paul Krugman is a Nobel Prize-winning economist and former professor at MIT and Princeton who now teaches at the City University of New York's Graduate Center. From 2000 to 2024, he wrote a column for The New York Times. Please consider subscribing to his Substack.
Reprinted with permission from Paul Krugman.