Tag: income inequality
Larry Mishel

Happy Labor Day To The Steadfast Economists Who Fight For Working Families

When I think about labor and labor economics, I think Economic Policy Institute. So, my gift to you on this Labor Day is to briefly tell or remind you about EPI’s essential role in our economic debate and to get your butt over to their robust website, if you’re not there already—and not just on Labor Day, but everyday. The institute is a spry 40 year-old this year, and they’re at the top of their game.

It’s where I cut my teeth as a junior economist, working with EPI’s former president Larry Mishel and many co-authors on numerous volumes of The State of Working America.

There are three ways I’d summarize the foundations upon which the Institute is built.

—First and foremost, EPI puts bargaining power in the center of their analysis. It’s only slightly reductionist to argue that classical economics leaves this force out, yet it’s a key determinant of economic outcomes. Non-power-based analysis assumes you pretty much get what you deserve (your “marginal product”) though the liberal version allows for gender- and race-based discrimination.

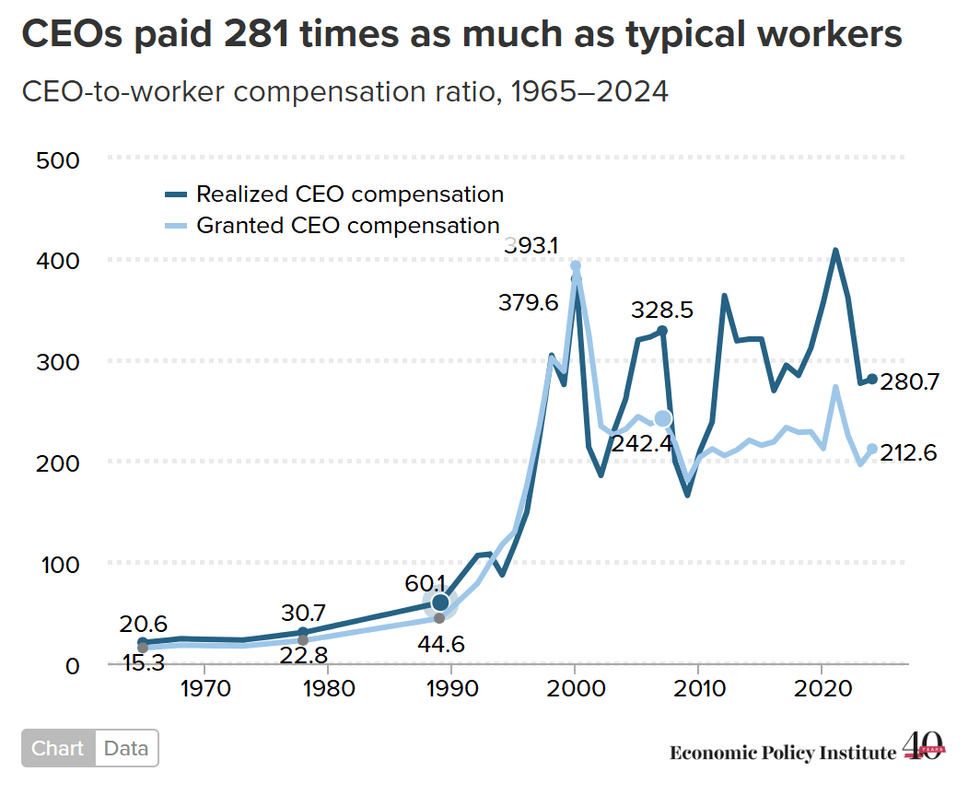
Power-based analysis doesn’t reject the importance of education and experience, but it recognizes that you can’t explain trends like the one shown below without placing power imbalances at the center of the model.
—Second, market failures lurk around more corners than you think. Working back from the fact that power plays a dominant role in economic outcomes, from access to opportunities to the distribution of income and wealth, EPI’s analytic perspective doesn’t accept that unfettered markets deliver optimal outcomes, with rare exceptions for classical externalities, like pollution.

This is why “Policy” is their middle name. We live in a world of “multiple equilibria,” wherein we can craft economic policy to stress fairness, broadly rising living standards that track productivity (this figure, first derived by me and Larry, launched many battles and remains as relevant as ever), and opportunities for all to realize their economic potential.

Or we can accept policies that do the opposite, that reward capital over labor, as do our current tax policies, that allow child poverty to exist when we know we can sharply cut it (see Biden-era impacts therein), that set a decent wage floor, that allow unions to grow to meet the demand for such representation (“56 million workers would join a union if they could”), and so on.

If you want, think of EPI as “The Institute for Promoting Policies to Achieve a Much Fairer Equilibrium,” though I submit that title’s a bit more cumbersome.

—Finally, and this dates back to Mishel and the other early founders, the work is of academic caliber. From its inception to this day, EPI’s researchers adhere to high empirical standards. We knew from the beginning that if you’re going up against the powers that be, who have far deeper pockets than you do, you’d better show up with your standard errors properly calculated.

No one’s saying facts win the day, of course, especially these days, with Trumpian alt-reality politics in control. But the reason EPI is still flourishing in middle-age is in no small part because they’ve got the rigorous research to back up their arguments.

So, enjoy the day, the cookouts, relaxing with friends, etc. But if you can, spend 20 minutes clicking through the EPI website. What you’ll see there is no less than a very different model of how the economy ought to work, along with a policy roadmap of how to get there.

Jared Bernstein is a former chair of the White House Council of Economic Advisers under President Joe Biden. He is a senior fellow at the Council on Budget and Policy Priorities. Please subscribe to his Substack, from which this is reprinted with permission.

Social Security Deficits Are Caused By Inequality, Not Demographics

Social Security Deficits Are Caused By Inequality, Not Demographics

The rich almost completely control debate in this country. There is no better proof of this fact than the current debate over the future of Social Security.

This has been conveniently framed as a problem of demographics. You know, too many people living long into retirement and not enough kids entering the workforce. That sounds compelling, as long as we don’t try to think about it too much.

First, we knew this basic story long ago. On the life expectancy side, we’re actually doing somewhat worse (better from the standpoint of the program’s finances) than was expected in 1982, the last time there was a major reform to the program. The projections from that year showed men living on average 16.6 years after they turned 65. We are beating that some in the current projections at 18.2 years. But the story for women looks considerably worse than was projected in 1982, 20.7 years now compared to a projection of 22.6 years in 1982. So, we can’t say the problem is people are living longer than expected.

The fertility rate has fallen behind projections. and that has made the financing of the program worse, but the big story is that wage growth has fallen far behind the pace projected in 1982. The projection in 1982 was that real wages (the gap between wage growth and prices) would grow 1.8% percent annually for the indefinite future. And this wage growth was assumed to be for the workforce as a whole; there was no anticipation that there would be substantial changes in the wage distribution.

Inequality Matters Big Time for the Finances of Social Security

If real wages had grown as projected, they would have increased by more 120 percent between 1982 and the present. Instead, median wages have risen by just over 30 percent.

A big part of this story is that productivity growth has been weaker than was projected. But an even larger part is that there has been a huge upward redistribution of income over this period. If wages had kept pace with productivity growth, they would be more than 60 percent higher than they are today.

This directly matters for Social Security’s finances for two reasons. The first is that a much larger share of wage income has gone over the payroll cap. The cap rises in step with average wages, not the typical worker’s wages. As a larger share of wage income went to those at the top, Wall Street types, CEOs and other top executives, and highly paid professionals, less was subject to the Social Security tax. In 1982. only 10 percent of wage income avoided taxation. Now it’s close to 18 percent of wage income.

And since the turn of the century, a larger share of income has been going to corporate profits. This money also escapes taxation for Social Security.

There is also the issue that if wages had been growing more rapidly over the last half-century, tax revenue would be higher relative to benefit payments. Benefit payments after retirement are indexed to prices. If wages outpace prices, tax revenue increases relative to benefits. The Trustees calculate that a 0.1 percentage point increase in the annual rate of real wage growth is equivalent to a 0.2 percentage point increase in the tax rate.

If real wages had grown by roughly 1.0 percentage point faster over the last half-century, and were projected to continue to grow at that pace, it would eliminate most of the projected shortfall in the trust fund.

The Indirect Effect of Growing Wage Inequality

This direct effect of growing inequality accounts for far more than half of the gap in Social Security’s finances, but there is also a very important indirect effect. In 1960, the Social Security tax rate was 6.0 percent, combining the employer and employee side contributions. By 1990, the tax rate had risen to 12.4 percent, an increase of 6.4 percentage points over 30 years. In the last 35 years, the tax rate has not increased at all.

In the context of weak real wage growth and a massive upward redistribution of income, it is understandable that there would be enormous resistance to any further tax increases to support Social Security. But suppose real wage growth had kept pace with productivity over the last half-century, and we had not seen the massive upward redistribution to Elon Musk, Mark Zuckerberg, and the rest.

I’m an economist, not a political consultant, but my guess is that if real wages were more than 60 percent higher, most workers would be okay with a 1-2 percentage point increase in the tax rate to secure Social Security for themselves and their children. This was the case for workers in the decades from 1960 to 1990, who put up with much larger tax increases.

The Government DID Upward Redistribution; It Didn’t Just Happen

The other part of this story that is essential for everyone to understand is that the upward redistribution was brought about by government policy; it did not just happen. The most obvious way this happened was through government-granted patent and copyright monopolies. These government-granted monopolies make folks like Larry Ellison and Bill Gates incredibly rich. They also make prescription drugs and medical equipment very expensive, when they would be cheap in a free market.

The government has protected the financial industry with bailouts, tax policy, and bankruptcy laws that allow private equity barons and Wall Street tycoons to become rich at the expense of the rest of us. If we drafted the laws to promote efficiency, we would have a much smaller financial sector and fewer and poorer billionaires.

We also have written and enforced labor laws to the detriment of unions and workers. Most obviously by banning contracts that require all workers who are represented by a union to pay for that representation. While these contracts are not enforceable in most states, contracts that prevent workers from working for a competitor are enforceable.

These and other policies that were designed to redistribute income upward have had their intended effect of taking money from the rest of us and giving it to the rich and very rich. And now that their upward redistribution has had the effect of undermining the financing of the country’s most important social program, they want to cut Social Security. It’s essential that people stand up to the lies; the problem is the rich taking too much of our money, not overly generous Social Security benefits.

Dean Baker is a senior economist at the Center for Economic and Policy Research and the author of the 2016 book Rigged: How Globalization and the Rules of the Modern Economy Were Structured to Make the Rich Richer. Please consider subscribing to his Substack.

Trump's Gargantuan Pentagon Budget And The Social Security 'Shortfall'

Trump's Gargantuan Pentagon Budget And The Social Security 'Shortfall'

The release of the 2026 Social Security Trustees Report got the usual suspects (a.k.a. “very serious people”) genuflecting about the large projected shortfall. As of 2034, the program is projected to be unable to pay full benefits. This would mean a 22% cut in benefits if no additional revenue is added.

There are three points worth making here.

1) As an economic matter, the projected depletion of the trust fund and resulting shortfall in the program means nothing;

2) The main reason for the projected shortfall is the upward redistribution of income over the last half-century;

3) The projected shortfall is far less money than the increase in military spending that Donald Trump is requesting for his 2027 budget.

Trust Fund Accounting

On the first point, the spending to repay the bonds held from the trust fund in 2033 comes from the Treasury. Its impact on the economy would be the same as the spending in 2034, when the trust fund no longer holds any bonds.

There is an issue that the law gives the program a claim to the funds needed to repay the bonds it holds. Social Security does not have a claim to the money needed to pay full benefits once the last bonds are sold and the trust fund is depleted.

This is an important legal point, but from an economic standpoint, it is money from the Treasury in both cases. If the country could afford to pay full benefits in 2033 when the trust fund held bonds. It can afford to pay full benefits after it has sold all its bonds, however the law would need to be changed.

Upward Redistribution Hurt Social Security’s Finances

In 1982, the last time the program had a major overhaul, just ten percent of wage income went to high wage earners whose income escaped taxation by being over the cap (currently around $185,000) for wages subject to the 12.4 percent Social Security tax. In the last quarter century, close to 17 percent of wage income went over the cap.

This upward redistribution of wage income, coupled with the redistribution from wages to profits in the last quarter century, has substantially reduced the amount of revenue going into the trust fund. It shouldn’t be surprising that the people who engineered the upward redistribution of the last half-century, through trade policy, stronger patent and copyright protections, bank bailouts, and tech policy, now want to reduce people’s Social Security benefits.

Trump’s Increase in Military Spending is Twice the Size of the Shortfall Projected for 2034

The media seem to take pride in reporting huge budget numbers without providing any context that would make them meaningful to their audience. The projected Social Security shortfall is a great example. The usual group of budget hawks is being brought out to tell us that it is a huge program, which we can’t afford, and requires cuts.

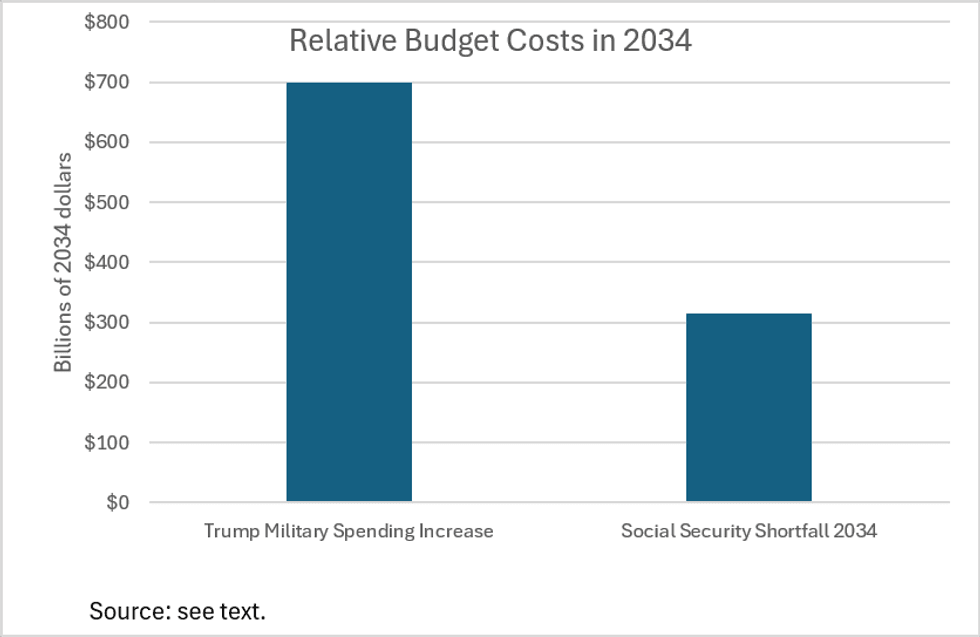
Yet, we did not hear the same chorus in response to Donald Trump’s proposed increase in the military budget from $864 billion in the last year of the Biden presidency to $1,500 billion in 2027. Even adjusting for inflation between the two years, the increase would still be close to $590 billion. There was no rationale given for why the country suddenly needs to spend so much more on its military. Trump certainly did not propose this sort of massive increase in spending in his campaign.

The proposed increase in military spending dwarfs the shortfall projected in the Social Security program for 2034.

Adjusting for inflation (assuming 2.5 percent annually), Trump’s requested increase would be just under $700 billion in 2034 dollars. By contrast, the Social Security Trustees project that the program will face a $314 billion shortfall in its annual budget in 2034.

We can argue about what should be considered big and what should be considered small, but there is zero doubt that Trump’s proposed increase in military spending is hugely larger than the projected shortfall in Social Security. If anyone thinks that Social Security poses a big problem for the budget, they must believe that Trump’s military spending poses a much bigger problem, since it is more than twice as large.

And, as noted earlier, we are already paying the money for Social Security; it is just coming out of a different pocket. The proposed increase in military spending, at 1.6% of GDP, will be newly committed funds coming from the Treasury, which will impose substantial demands on the economy. Any honest person who says funding Social Security poses a serious budget problem must believe that Trump’s military spending poses a far bigger problem.

As Health Insurance Premiums Spike, Inequality Worsens -- But There Is A Solution

As Health Insurance Premiums Spike, Inequality Worsens -- But There Is A Solution

It’s not just people with Obamacare plans who face huge premium spikes next year. Workers with employer-based plans, which cover nearly half of all Americans, are also getting hit with very large increases in their premiums.

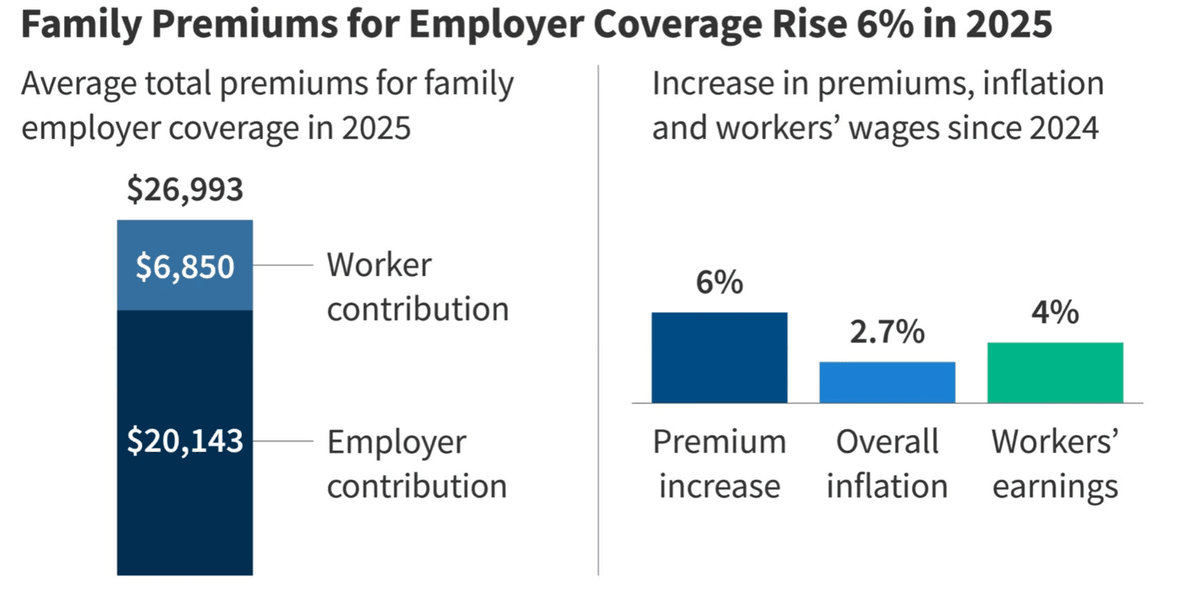
The annual survey by Mercer, a major employer benefits consulting firm, found health benefit costs per employee are expected to rise 6.5% in 2026, which would be the highest increase since 2010. Total plan costs-per-employee will increase nine percent, which employers will partially offset by “raising deductibles and other cost-sharing provisions, which can lead to higher out-of-pocket costs for plan members when they seek care.”

One of those “other cost-sharing provisions” — the one that will hit everyone and not just those who get sick — are the co-premiums for their plans, which are taken each week or month out of their paychecks. Historically, employers pick up about 75 percent of the cost of family plans. So when the total costs goes up 6.5 percent, so does the 25 percent share paid by employees.

How much will that cost workers? According to the Kaiser Family Foundation annual survey of employer-based insurance, the average worker paid $6,850 for a family plan in 2025. A 6.5 percent increase in 2026 will sap paychecks by an average of $445. That’s nearly a one percent reduction in the median worker’s take-home pay.


Source: Kaiser Family Foundation

This has gone on for the decades, and will continue as long as health care costs rise faster than wages. A study published in JAMA Network Open last year calculated lost earnings from the growth in health insurance premiums between 1988 to 2019 cost the average family over $125,000 in inflation-adjusted dollars, or nearly 5% of total earnings over the entire 32-year period.

Low-wage workers bear the brunt

But averages don’t tell the whole story. The income-sapping surge in co-premiums for health insurance hits low-income workers much harder than high-income workers because of the way employers structure their health insurance plans.

Most employers that offer health insurance to their employees provide three plan options. The most expensive is the preferred provider organization (PPO) plan. The middle-priced option is usually a health maintenance organization (HMO) plan, which places limits on provider choice. And then there is the high-deductible plan, which is the least expensive but can leave plan participants with huge and unaffordable bills when they get sick.

Not surprisingly, the lowest cost high-deductible option is most attractive to employers’ lowest-paid workers, who are desperate to hold down their upfront health care costs because they need the cash to pay other bills. Middle-income workers may opt for the HMOs, while upper income employees are the most likely to opt for the PPO plans. They can afford them, and they appreciate the ability to see any doctor they choose.

Most employers unwittingly exacerbate this class stratification in private health insurance. More than three-quarters of employers charge every employee, no matter what their income, the same co-premium within each plan option, according to a 2019 Bureau of Labor Statistics survey. Everyone who choose an HMO plan, for instance, faces the same co-premium. That means lower wage workers are paying a higher share of their income for health insurance compared to others who choose the same plan.

Time to graduate

There is a way to bring greater equity to employer-based health insurance. It is something more employers should consider given the growth in income inequality over the past half century.

They could adopt income-based co-premiums, which are sometimes called tiered co-premiums. In a tiered system, those with the lowest incomes pay lower co-premiums for any of the three choices, while those with higher incomes pay more for the same plans. Tiered co-premiums operate like a graduated income tax.

For example, Honolulu-based Alexander & Baldwin, a real estate firm, dropped its one-size-fits-all co-premium structure in 2023. It established three tiers for its more than 100 employees. A single worker in the lowest salary range paid $42 a month for an HMO plan; the middle salary range paid $67 a month for the same plan; and the highest paid workers paid $92 a month.

Universal tiering of co-premiums — something that could be mandated by federal regulation — will not address the burden placed on all Americans by rising health care costs, which this year are being driven by exorbitant hospital and drug prices, rapid uptake of weight-loss drugs, and soaring costs for imported medical products due to Trump’s tariffs. But it will bring equity when it comes to bearing the burden of those rising costs.

Merrill Goozner, the former editor of Modern Healthcare, writes about health care and politics at GoozNews.substack.com, where this column first appeared. Please consider subscribing to support his work.

Reprinted with permission from Gooz News

Shop our Store

Headlines

Editor's Blog

Trending

World