

Payrolls popped by a strong 130,000 last month, a welcome boost that came in at about twice what was expected and a stark contrast to new, historical revisions in today’s report that significantly reduced last year’s gains. The jobless rate ticked down to 4.3 percent, as more workers entered a workforce that was more welcoming in January than it was last year.
Speaking of last year, there’s a different side to this report showing that the American job machine stalled in 2025. I’ll go deep into the new revisions out today that tell this story, but topline: unrevised job gains for last year were an already historically low 584,000, the weakest year since 2009 (excluding the 2020 pandemic year), but the revised data show just 181,000 jobs created last year, about 15k/month. For manufacturing, the ‘25 count fell even further into the red, from -68,000 to -108,000.
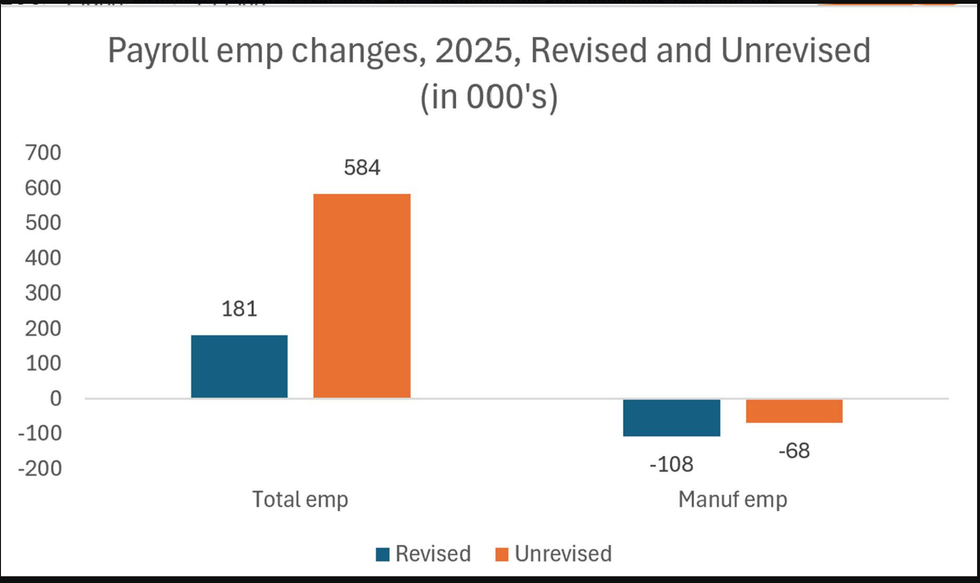
For 2024, the revised gains fell to 1.5 million from 2 million.
So, what in Keynes' name should we make of this good news, bad news story?
Well, it’s a good month to remember that one-month’s data, especially if it’s against the trend, shouldn’t change your broader take. But neither should it be wholly discounted. In fact, the payroll survey has been quite hard to parse lately, and the fact that the unemployment rate (which is from the other survey) has ticked down two months in a row, from 4.54 percent in Nov to 4.28 percent in December suggests the job market is still ticking.
Let’s start with the good news. The January jobs report had a lot of solid data points, though federal gov’t employment is relentlessly tanking.
--As noted, the jobless rate ticked down to 4.28 percent,
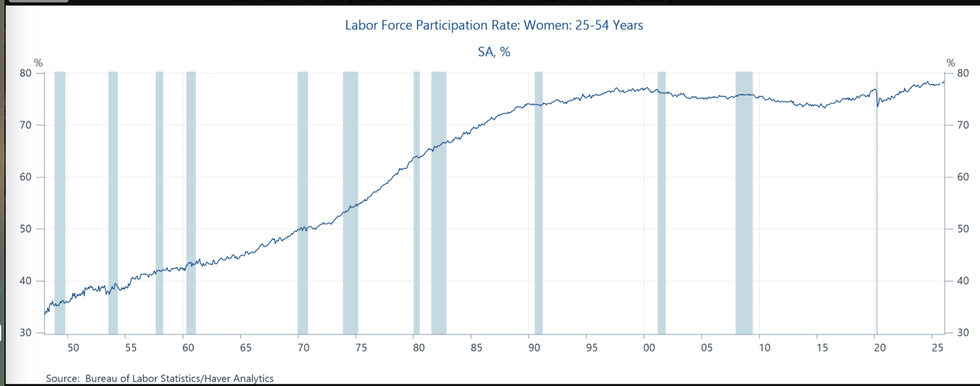
--The labor force participation rate for prime-age workers (25-54), a good proxy for labor demand, went up three-tenths to 84.1 percent and the prime-age rate for women rose to an all time high of 78.4 percent, from a data series that starts in the late 1940s!
--A number of indicators suggest stronger labor demand in January: Involuntary part-timers fell by 450,000 (noisy, monthly data, but still…); Black unemployment was 8.2 percent in Novembrer; it’s 7.2 percent in January (though that’s still a point above January 2024).
--Weekly hours worked ticked up, and nominal hourly wage growth held steady at 3.7 percent year-over-year. That’s a solid point above inflation.
--Manufacturing, which, as you see above, took a real hit in the revisions, going from bad to worse, added 5,000 jobs in January, its first monthly gain since November 2024. Good news for the month, but the trend here is firmly negative, and anyone who says “this shows the tariffs are working!” is full of it.
--55 percent of private industries added jobs last month, still below the pre-pandemic share of around 60 percent but up from recent lows.
--Health care continues to outperform; construction and social assistance also contributed to the January job gains.
--Federal governmentt jobs continue to hemorrhage, down 34,000 last month. As the Bureau of Labor Statistics reported: “Since reaching a peak in October 2024, federal government employment is down by 327,000, or 10.9 percent.”
The Revisions
Today’s jobs report contains numerous revisions, one of which—the annual benchmark revision—is particularly consequential in terms of understanding the trajectory of recent payroll employment.
Every year, the level of employment in the payroll survey gets adjusted up or down based on more complete data from the (very-close-to-a) census of jobs the BLS collects for the UI system. This year, the revision was an historically large -898,000, meaning that’s how much lower the level of employment was in March of last year. To avoid a big negative spike in the series, they wedge the -898K in by subtracting 1/12 of that number from the unrevised payroll levels starting in April of 2024.
Even with the January upside surprise, this obviously isn’t good. I’ll explain why in a moment, but there’s a contextual point that must be kept top-of-mind when using these payroll numbers to assess the health of the labor market. Because the growth of the labor force has slowed considerably—deportations, aging workforce—there are fewer job seekers. It thus takes fewer jobs to keep the unemployment rate from rising.
Whenever you go from payrolls to unemployment, you’re crossing surveys. They’re cousins, not siblings. But the fact that the jobless rate hasn’t gone up more, given how flat payrolls were last year, tells us that we need fewer jobs than we did a few years ago to keep the job market on track. Yes, labor demand is down (see payrolls), but so is labor supply (see unemployment rate).
Still, any economic market without churn, whether its jobs or housing, is stagnant. Sure, it’s bad feng shui, but it has concrete, negative impacts, even if layoffs remain as low as they’ve been. It takes longer for new entrants to find work, and a career trajectory delayed is a tougher career trajectory. It contributes to our lower quit rates, which are associated with diminished occupational mobility. It creates less wage pressures, especially for middle/lower paid workers.
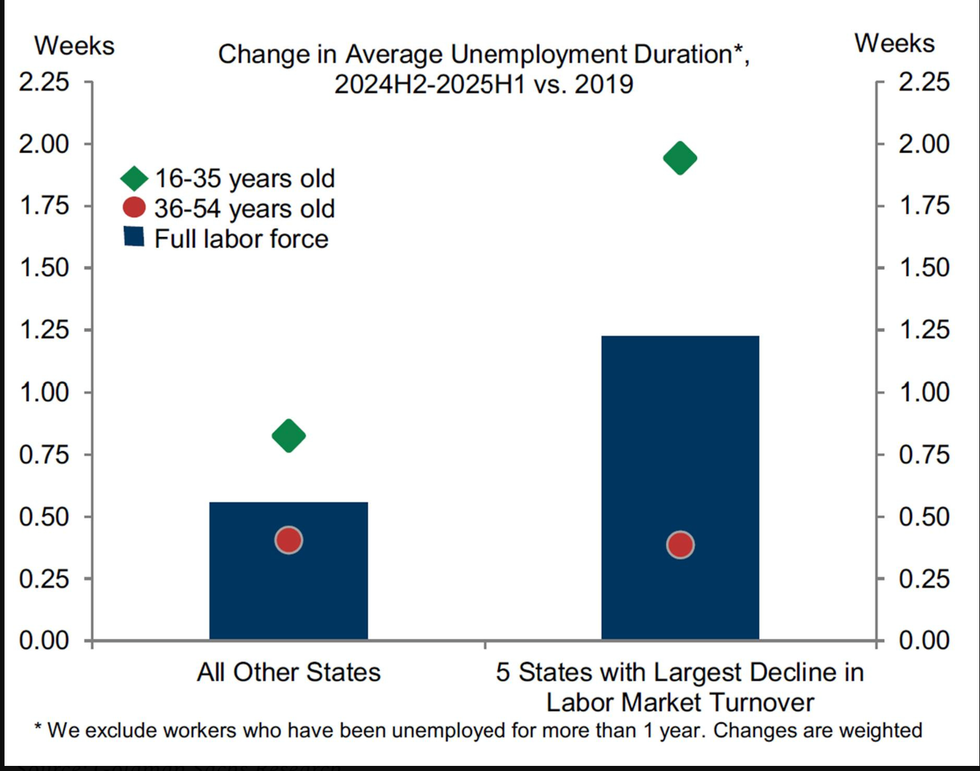
Consider, for example, the figure below from GS Research. It shows that if you take the five states with the biggest decline in turnover (hires, fires, quits), you find a steep increase in jobless durations, especially for younger workers. Other data shows this effect to be particular tough for young college grads. (AI? It may be in the mix—I’d be surprised if it wasn’t—but still hard to tell.)
Other revisions including adjusting seasonal factors, which evolve over time and tend not to be a big deal for how we understand history, and the birth-death model, which is a bit more consequential to the jobs count. The Establishment Survey gets its payroll info from over 600,000 individual worksites, picking up 1/4 of actual employment. The BLS then uses sampling methods to weight up the sample to represent the population.
The problem is that there’s “an unavoidable lag between an establishment opening for business and its appearance on the sample frame making it available for sampling. Because new firm births generate a portion of employment growth each month, non-sampling methods must be used to estimate this growth.” So, they must model firm births and deaths, and data from their revised model are plugged into the payroll data starting in April of last year. In the past two months, the revised birth-death model reduced (not seasonally adjusted) payroll gains by about 160,000.
So, bottom line: a strong January jobs report shows that the US labor market is clearly showing signs of life. Demand, even if it’s K-shaped, is still pretty strong, and, at least in January, that helped to boost jobs and lower unemployment. But one month does not a new trend make, and especially given the historically large and negative revisions, we should definitely still consider ourselves stuck in a low-hire, low-fire labor market, with all the dynamic downsides therein.
Jared Bernstein is a former chair of the White House Council of Economic Advisers under President Joe Biden. He is a senior fellow at the Council on Budget and Policy Priorities. Please consider subscribing to his Substack.
Reprinted with permission from Econjared.
- Trump Withdraws Nomination Of Top BLS Official Amid Critical Blast ›
- Feeling Insecure At Work? That Fear Is Real -- And You Can Blame Trump ›
- 'Perfect Guy': Bannon Thrilled By Trump Pick To Oversee Jobs Data ›
- Still No Jobs Report, But Trump's Labor Market Isn't Looking Good ›