
Tag: productivity
Despite Strong May Jobs Report, Wages Aren't Keeping Pace With Inflation

Despite Strong May Jobs Report, Wages Aren't Keeping Pace With Inflation

The May Jobs report was stronger than most people, including me, had expected. The 172,000 jobs created is not exactly earth-shattering, but in a context where immigration has been largely shut off and the labor force is barely growing, it is a lot. Plus, the two prior months’ data was revised up, so the average over the last three months is 188,000.

That looks pretty good, but the separate household survey looks less good. The unemployment rate held steady at 4.3 percent, which by historical standards is low, but it’s almost a full percentage point higher than the 3.4 percen t low hit in the spring of 2023.

More striking is that the rate did not fall, given the rapid job growth reported in the establishment survey. As the establishment data has shown strong job growth, the household survey actually showed a small drop in employment from the February level. To be clear, the surveys often are not aligned, so this discrepancy is not especially striking, but it is worth noting.

Anyhow, I have five main takeaways from the May report.

1) Jobs are growing far faster than the breakeven rate

2) Wages are not keeping pace with inflation

3) Workers are still reluctant to leave jobs

4) Job-killing AI is not visible in the data

5) Self-employment is lagging

Good Job Growth, but Heavily Concentrated

The entire 172,000 job growth came from three sectors: leisure and hospitality, local governments, and healthcare and social services. These sectors added 70,000 jobs, 55,000 jobs, and 47,200 jobs, respectively. To be clear, other sectors added some jobs. Construction added 17,000 jobs, manufacturing added 7,000 jobs, but with sectors like finance and wholesale trade losing jobs, the net outside of these sectors was zero.

The job growth in the healthcare and social services sector was not surprising. It has been adding jobs at a rapid pace throughout the recovery. This is the story of aging baby boomers needing more care. Most of the growth in the social service category is home healthcare aides. This growth will likely continue.

The growth in local government employment is a surprise. Most local governments are facing financial problems as funding from the federal government has been curtailed in many areas. It is unlikely this growth will continue and may be reversed in future months.

The leisure and hospitality story is the hardest to explain. Most of this growth (48,000) was in restaurants. This doesn’t seem to fit the data on spending. According to the Commerce Department, inflation-adjusted spending in restaurants is down by 1.0 percent since September. Yet employment is up by 154,000 or 1.2 percent. These changes will never match up precisely, but this is a large divergence. Maybe restaurant workers are getting less productive for some reason.

There are some interesting stories in construction and manufacturing. Construction has added 65,000 since December, an average of 13,000 a month. That is not exactly earth-shattering, but the sector lost 4,000 jobs in 2025.

Similarly, manufacturing is showing modest job gains this year, adding 25,000 jobs since December. The durable goods sector has been doing even better, adding 46,000 jobs. Again, this is not exactly a great story, but at this pace the sector could get back the jobs lost in 2025, sometime next year.

In any case, with immigration likely near zero, the number of jobs needed to keep pace with the growth of the labor force is in the 30,000-60,000 range. We are well above that pace in the last three months.

Wages Are Falling Behind Inflation

Wage growth is continuing to slow, with the year-over-year increase at just 3.4 percent. That is down from being slightly above 4.0 percent in 2023 and 2024. Tariffs and the war-related surge in energy prices have pushed inflation higher. It had been slowing toward 2.0 percent in 2024, but it now is at 3.8 percent and likely to hit 4.0 percent when we get the May Consumer Price Index next week.

Slowing wage growth in the face of rising inflation seems hard to reconcile with strong job growth and relatively low unemployment. Workers should be in a position to get higher wages, but that does not seem to be the case.

Workers Are Reluctant to Leave Their Jobs

One factor that can help to explain weak wage growth is the reluctance of workers to leave their jobs. We know from the Job Openings and Labor Turnover Survey (JOLTS) that both quits and hires are very low. This is also reflected in the relatively low share of unemployment due to voluntary quits. This rose from 11.3 percent in April to 12.5 percent in May, but that is still below the 13.2% average in the 2018-19 period of comparably low unemployment. The fact that the duration measures of unemployment are all relatively high, and rose last month, suggests that workers are right to be wary.

The Job-Killing AI is Still Hiding from the Statistical Agencies

If AI is allowing us to do more with fewer workers, it should show up in more rapid productivity growth. We are not seeing this in the data. Productivity growth was just 1.6 percent in the fourth quarter and 0.3 percent in the first quarter. We had been seeing growth in excess of 1.5 percent earlier in the recovery. And we had growth of just under 3.0 percent annually in the long post-war boom from 1947-1973.

Based on the April and May data, it looks like hours will grow at close to a 2.0 percent rate in the second quarter. Unless we get some blockbuster growth numbers for output in June, we will have another quarter of weak productivity growth. Either the story of job-killing AI is yet another economic myth, or the AI is much smarter than we think, and is hiding from the statistical agencies.

Self-Employment is Weak

One story of AI is that it is supposed to make it easier for people to start businesses. We are in fact seeing a strong uptick in new business formation. However, this is not showing up in the data on self-employment.

Taking an average of the last three months, incorporated self-employment is down by 1.0 percent from the year ago, while unincorporated self-employment is down by 4.2 percent. This is a contrast from earlier in the recovery when self-employment was rising rapidly. Incorporated self-employment in the months from March to May was 10.8 percent higher than it had been in 2019, before the pandemic. Unincorporated self-employment was 6.0% higher. This story could change, but for now, it doesn’t look like AI is leading to a boom in self-employment.

Questions for Next Month

The May report definitely had some good news, but also raises many questions. What good jobs report doesn’t?

Some of the things I will be looking for is what happens to local government employment, is wage growth picking up, are people quitting their jobs? But we have a month to worry about these things.

Dean Baker is a senior economist at the Center for Economic and Policy Research and the author of the 2016 book Rigged: How Globalization and the Rules of the Modern Economy Were Structured to Make the Rich Richer. Please consider subscribing to his Substack.

A Decent Slice: The Affordability Crisis Isn't Only About Prices

A Decent Slice: The Affordability Crisis Isn't Only About Prices

As readers know, I yield to none when it comes to elevating the affordability crisis, along with the policy and politics therein. But in most of my work in this space, I at least tip my hat to the fact that it’s not just about P (prices). It’s about Y/P (where “Y” is income, so Y/P is inflation-adjusted, or real, incomes). By which I mean, affordability is not just about prices. It’s also about how far your paycheck goes, given how much things cost.

As Neale Mahoney and I wrote a bit ago:

Another way in which economists historically think about affordability is in terms of the real purchasing power of paychecks and incomes. That is, we are more prone to think about incomes relative to prices (Y/P) than prices in isolation. This makes good economic sense as an equal percentage increase in prices and incomes has no impact on affordability in real terms.

We go on to point out, however, that this…

…is not how most people tend to internalize the problem. As recent research by Stefanie Stantcheva has shown, people tend to credit themselves for wage or income gains but believe price increases are imposed on them by outside forces. This means that even when a price increase is matched by a wage gain, people end up feeling worse off.

I’m acutely aware of how much price levels—what things cost—have been a core source of economic angst for a good while now, which is why I’ve been devoting most of my policy time working with folks to craft affordability policies.

But that said, I’ve lately been seeing affordability takes that go too far for my comfort in leaving off the income part of the equation. A typical example shows a price of a good or service on the affordability docket, like groceries, going up over time, and declaring that therein lies the problem.

That’s a mistake on numerous levels. Progressives, especially in periods of rising inequality, have long argued that workers’ paychecks should grow closer to the rate of productivity, which is a fancy way of saying that the bakers, not just the bakery owners, ought to get a fair slice of the pie they’re baking. But, of course, as the Economic Policy Institute has long shown, that’s not always been the case (though contrary to claims that inequality only goes up, there are periods, often during full employment labor markets, wherein median compensation growth kept pace with productivity).

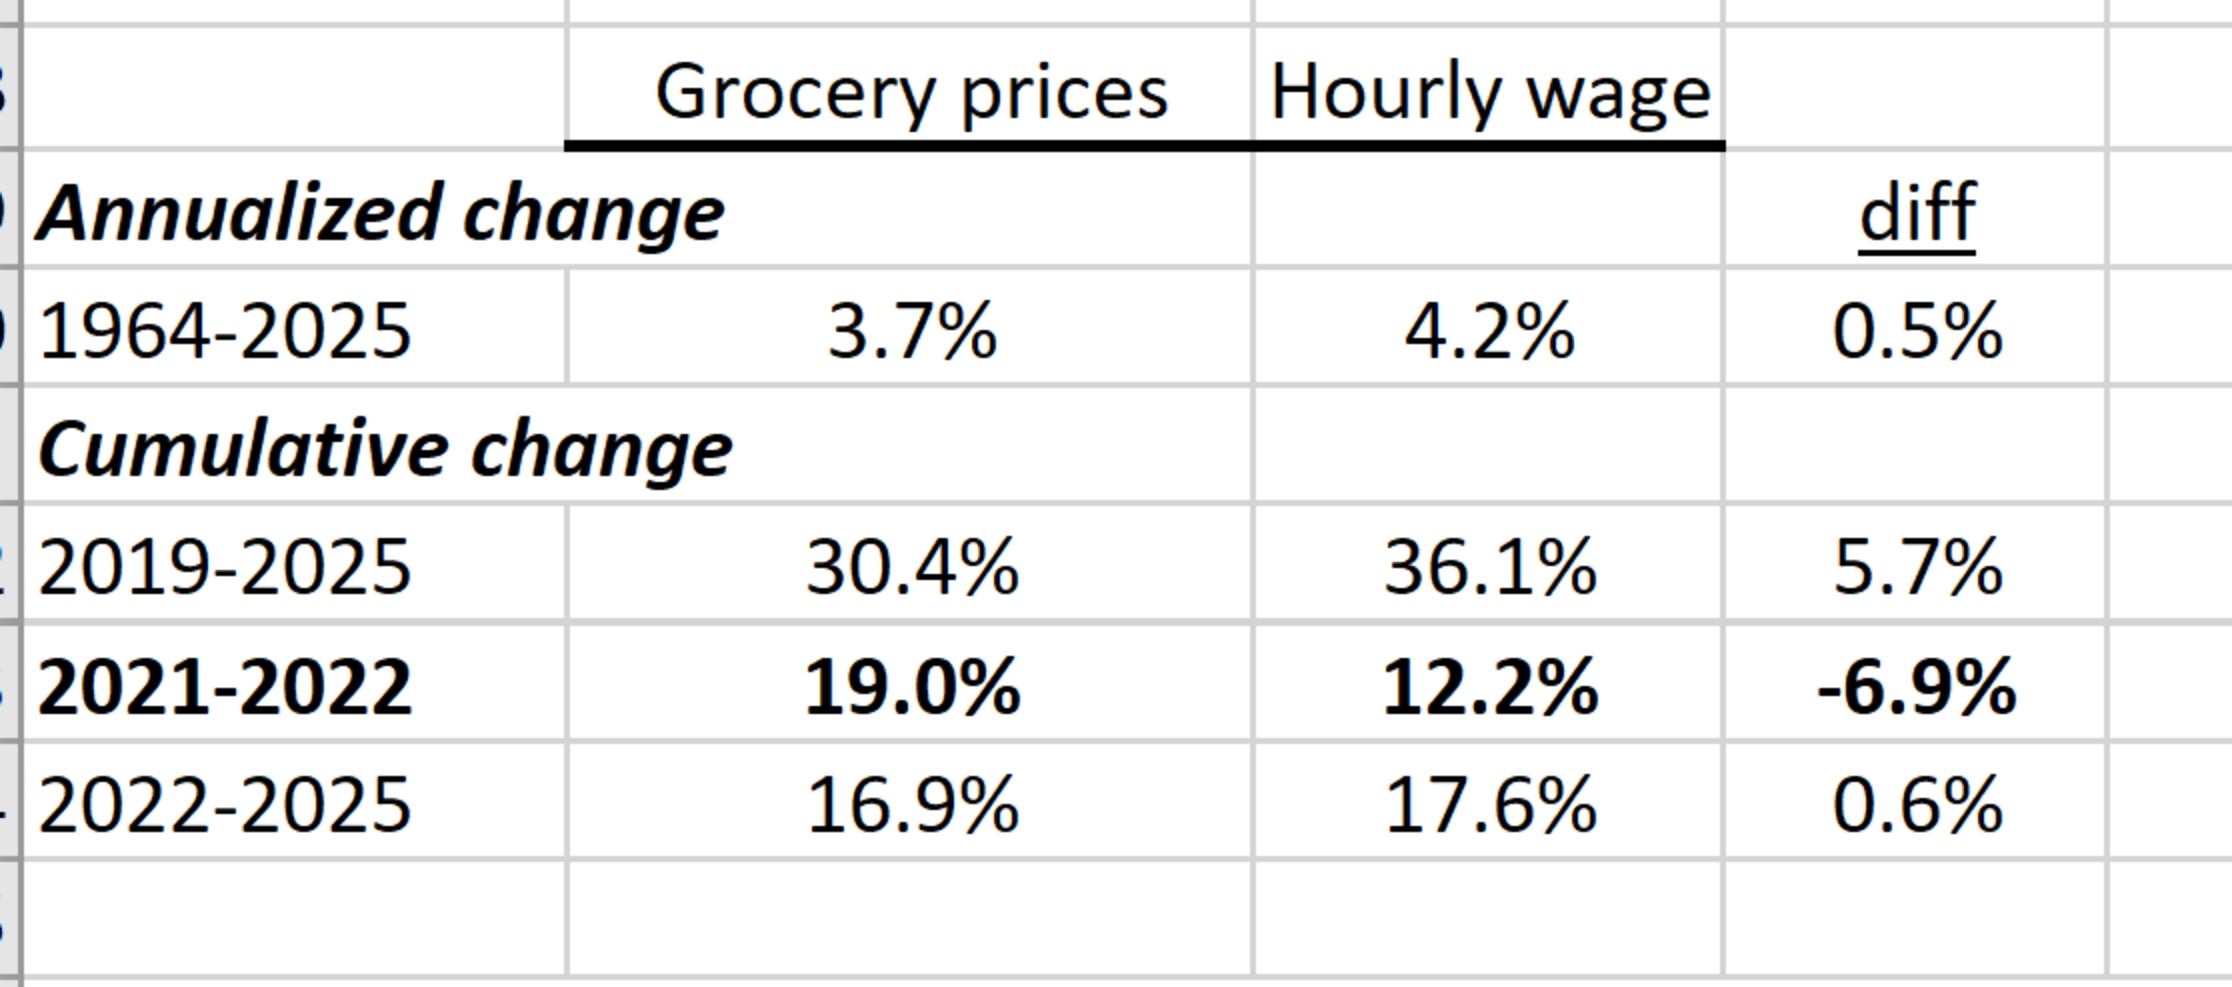
The table below provides a useful microcosm of this story by tracking the growth in both hourly wages and groceries over various time periods. Over the long-term, since the mid-1960s, annualized wage growth has outpaced grocery-price growth by a half-a-percent per year. Cumulatively since 2019, grocery prices are up by almost a third, which is a lot for this series, but wage growth is up almost six percent more since then.

Bureau of Labor Statistics data through August 2025, wages for production non-supervisory workers

However, the ‘21-’22 period, when inflation spiked in general and groceries in particular, wage growth lagged well behind. Though affordability issues had loomed large well before this shock, it was this sudden, huge jump in the price level—and again, not just groceries, but gas too, especially post-Russia’s invasion of Ukraine—that unleased the affordability crisis that remains predominant today.

How that crisis eventually dissipates must be some combination of these events: prices fall back to where they used to be, incomes growth outpaces price growth, effective affordability policies take hold, and time passes. Falling prices are very unlikely and, because it would take a huge, negative economic shock—think deep recession—to get there, not desirable (of course, removing the tariffs would definitely help for specific goods). I suspect if you asked the average person would you rather egg prices go back to where they were if it meant losing your job, they wouldn’t take the deal.

Policy work can help too, but a) not until competent policymakers are in power, and b) policymaking and implementation take time. And speaking of time, its passage is a critical piece of the puzzle. You don’t see me walking around enraged that gas is no longer $0.60/gallon, which it was when I started driving. In fact, the combination of low inflation, income growth beating that low inflation, and time passage is a reliable recipe for affordability, though, as noted, structurally unaffordable sectors like child care, health care, and housing must be addressed and ameliorated by policy.

I mentioned income growth above, so before we close, let’s look at that. Because hourly wages are the fundamental building block of working-family incomes, they were the focus of the grocery table above. But affordability at the household level is a function of n*h*w/p, were n is the number of people in the household who are working in the paid labor market, h is their average annual hours of work, and w/p is their average real hourly wage (and that’s just market incomes; non-market incomes, like tax credits, unemployment benefits, etc., also matter).

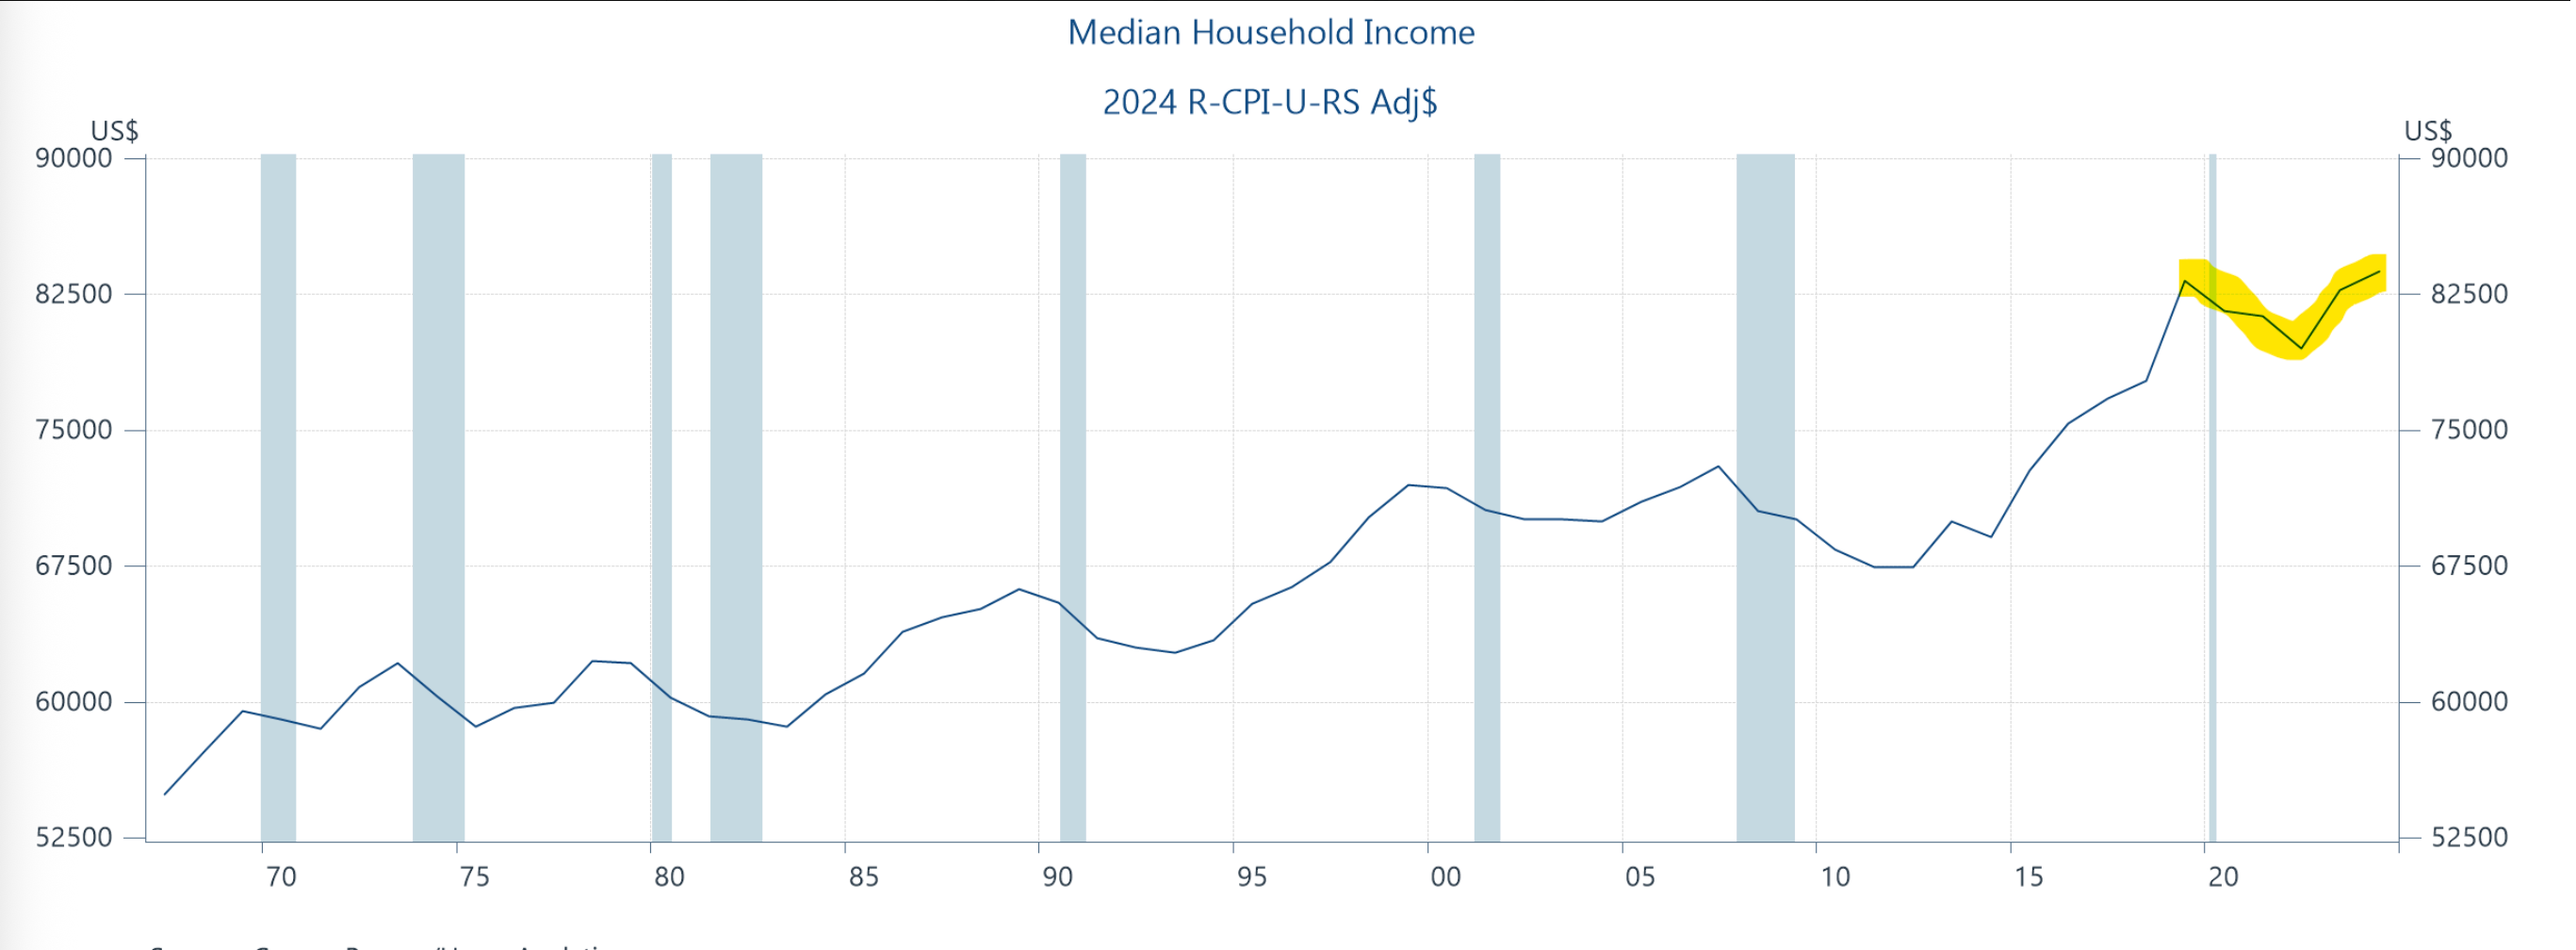
Here’s real median household income. Because of n and h in the formula above, it’s somewhat cyclical. In this regard, solid research reveals that tight labor markets help boost the bargaining clout of middle and lower-wage workers, boosting n, h, and w/p. But if you eyeball the end of the figure, you see the pandemic and the inflationary spike that followed led to sharply falling household incomes. From 2019-22, nominal income grew eight percent which isn’t bad, but inflation grew 13 percent, with the difference, -five percent, being the rate at which real income fell. That too is a source of the current affordability crisis.

But doesn’t the figure show household income jumping back up, and doing so with a slope that’s as steep as any other in the picture? Yes, it does, and that’s a key ingredient of the recipe above, driven by lower inflation, the strong job market, and solid real wage gains that for awhile there were stronger at the bottom of the pay scale than at the top. But you’ll also note that the recent gains just take the real income level back to where it was pre-pandemic, and that too feeds the affordability crisis.

Bottom line, while prices are understandably a current obsession, and the Stantcheva point above regarding the psychology of these dynamics is also in the mix, we must not ignore or downplay the importance of the earnings, incomes, wealth. They are just as important to affordability as prices, and the gap between real pay and productivity—i.e., wage inequality—is an historical factor that has played a key role not just in how people feel about economic fairness, but in how they vote about it.

Jared Bernstein is a former chair of the White House Council of Economic Advisers under President Joe Biden. He is a senior fellow at the Council on Budget and Policy Priorities. Please consider subscribing to his Substack.

Reprinted with permission from Econjared.

\


First-Quarter Productivity Decline Is A Grim Economic Portent

First-Quarter Productivity Decline Is A Grim Economic Portent

The Bureau of Labor Statistics today released its first estimate of productivity in the first quarter. It showed productivity falling at a 0.8 percent annual rate. This is really bad news.

Productivity matters a lot for both inflation and living standards. In the five years from 2019 to 2024, productivity growth averaged 1.9 percent annually. That is up from 1.1 percent annually in the decade before the pandemic.

The faster rate of productivity growth most immediately translates into lower inflation. As a first approximation, inflation will be equal to nominal wage growth minus productivity growth. If nominal wages are growing at a 4.0 percent annual rate, and productivity is rising at a 1.9 percent annual rate, inflation will be roughly 2.1 percent. (We could have some redistribution from profits to wages, reversing the rise in profit shares in the pandemic, but we’ll leave that one for another time.)

To take the other side of the same coin, real wages can sustainably increase at the rate of productivity growth. The 1.9 percent rate of productivity growth meant that real wages could rise at roughly a 1.9 percent annual rate. By contrast, the 1.1 percent rate for the decade before the pandemic could only support a 1.1 percent annual rate of real wage growth. Over the course of a decade that’s the difference between a 20 percent rise in real wages and an 11 percent rise.

For these reasons, the productivity slowdown reported for the first quarter is a big deal. Having said this, it is necessary to throw out two important caveats about the first quarter productivity data.

First these data are subject to revisions. Both the numerator or this equation (output) and the denominator (hours) will be revised in subsequent months. When we have the data in June, after two rounds of revisions, the picture may look very different.

The other important caveat is that productivity data are notoriously erratic. For example, productivity shrank at a 2.4 percent annual rate in the fourth quarter of 2015. It rose at a 1.7 percent annual rate in the first quarter of 2016. Reversals like this are very common. This means that even if the first quarter weakness holds up through revisions to the data, it is entirely possible that we see a sharp reversal in the second quarter or the second half of 2025.

First and foremost, the negative productivity growth reported for the first quarter should be seen a warning. We have pursued a number of policies that are likely to do both near-term and lasting damage to the economy. Tariffs, mass deportations, reckless layoffs in the federal government, and slashing research budgets, are all likely to hurt economic growth. Much of the impact will only be seen over the long term, but some may already be showing up in the data.

For example, if ships from China are not coming due to 145 percent tariffs, we will see fewer workers unloading goods, at the ports, fewer truck drivers transporting goods, and before long, empty shelves at the stores. The firings at the federal level, coupled with layoffs elsewhere due to cutbacks of federal support, could show up in higher unemployment rates.

The fall in productivity reported for the first quarter should be taken as a flashing yellow. Maybe all will be okay, but it’s not a good start.

Dean Baker is an economist, author, and co-founder of the Center for Economic Policy and Research. His writing has appeared in many major publications, including The Atlantic, The Washington Post, and The Financial Times. Please consider subscribing to his Substack Dean Baker.

Reprinted with permission from Substack.

Discover A More Productive Self With This Bundle Of Tips And Tricks

Discover A More Productive Self With This Bundle Of Tips And Tricks

There are only 24 hours in a day… no really, we checked. With more than half of that time taken up with sleeping, eating, traveling and other mundanities, you’ve really only got a handful of hours a day to truly get things done.

Make that precious window of time as fruitful as possible with the teachings of the Ultimate Productivity Bundle, which you can pick up right now for just $36 in The National Memo Store.

As opposed to courses and instruction that work on simply life or work production, this package of eight classes aim to improve how you spend your time in all aspects of your life.

You can start with courses and informative life lessons that help you approach life with added purpose, creating and establishing goals as well as motivating yourself to take those initial steps (How To Find Your Life Purpose & Maximize Your Impact27 Life-Changing Lessons From the Smartest People in History, and Get Things Done: How to Organize Your Life & Take Action).

From there, you can work on becoming a speed reader (Become A Speed Reading Machine: Read 300 Books This Year), boosting more much information you can retain in even less reading time than you’re spending now. Then you can tackle strategies for boosting your productivity (How To Double Your Productivity By Tomorrow Morning: 12 Step Guide), improving your time management (Make More, Work Less: Time Management + Productivity Course) and being a more efficient you at work (Entrepreneur Productivity Hacks).

You’ll even have a public speaking course so you effectively communicate all your successes and get others on a similarly productive track (Instant Public Speaking Master Class).

These courses usually cost almost $1,300, but with this limited time offer, you can get your whole life running like a Swiss watch for only $36.

This sponsored post is brought to you by StackCommerce. 

Shop our Store

Headlines

Editor's Blog

Trending

World